Fig. 7
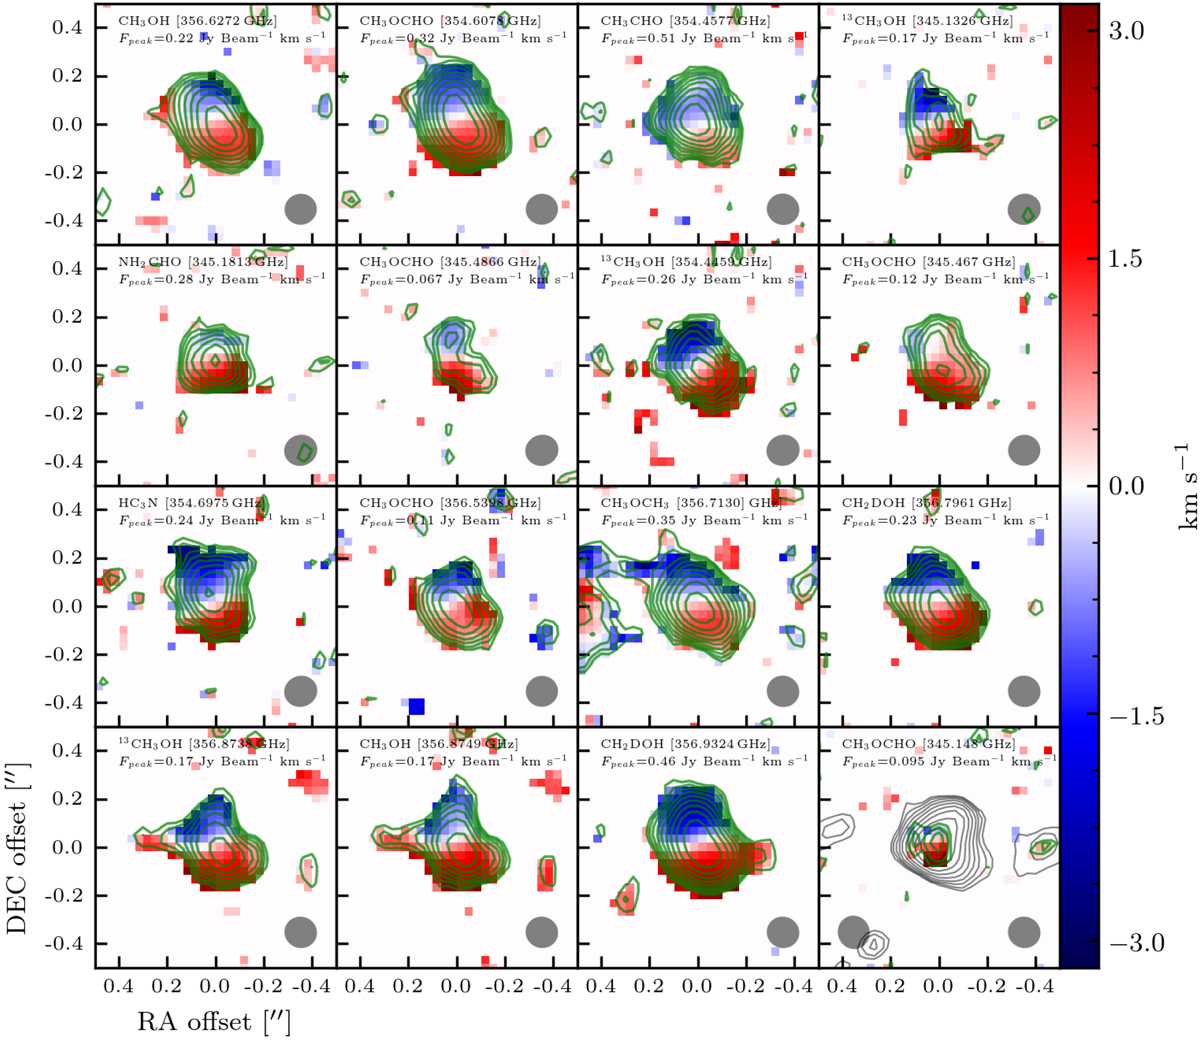
Moment 0 and 1 maps of observed COMs (Table B.2). Moment 0 maps are indicated in green contours, overlaid on the moment 1 map. The Cycle 3 857 μm dust continuum image is shown in the lower right frame in gray contours, and the beam size of the dust continuum observation is shown in the lower left corner of the same frame. Both dust continuum and the moment 0 map contours are spaced logarithmically between 5 and 100% of the peak emission, in 10 steps. The first two panels show the unblended lines of CH3 OH and CH3OCHO, while theremainder are blended to different degrees. The beam sizes of the molecule observations are shown in the lower right corner of each frame. The peak flux of the observed transition, Fpeak, is given in each panel, while the mean rms is 0.016 Jy beam−1 km s−1. All the datashown in this figure are from Cycle 3.
Current usage metrics show cumulative count of Article Views (full-text article views including HTML views, PDF and ePub downloads, according to the available data) and Abstracts Views on Vision4Press platform.
Data correspond to usage on the plateform after 2015. The current usage metrics is available 48-96 hours after online publication and is updated daily on week days.
Initial download of the metrics may take a while.