Fig. 6
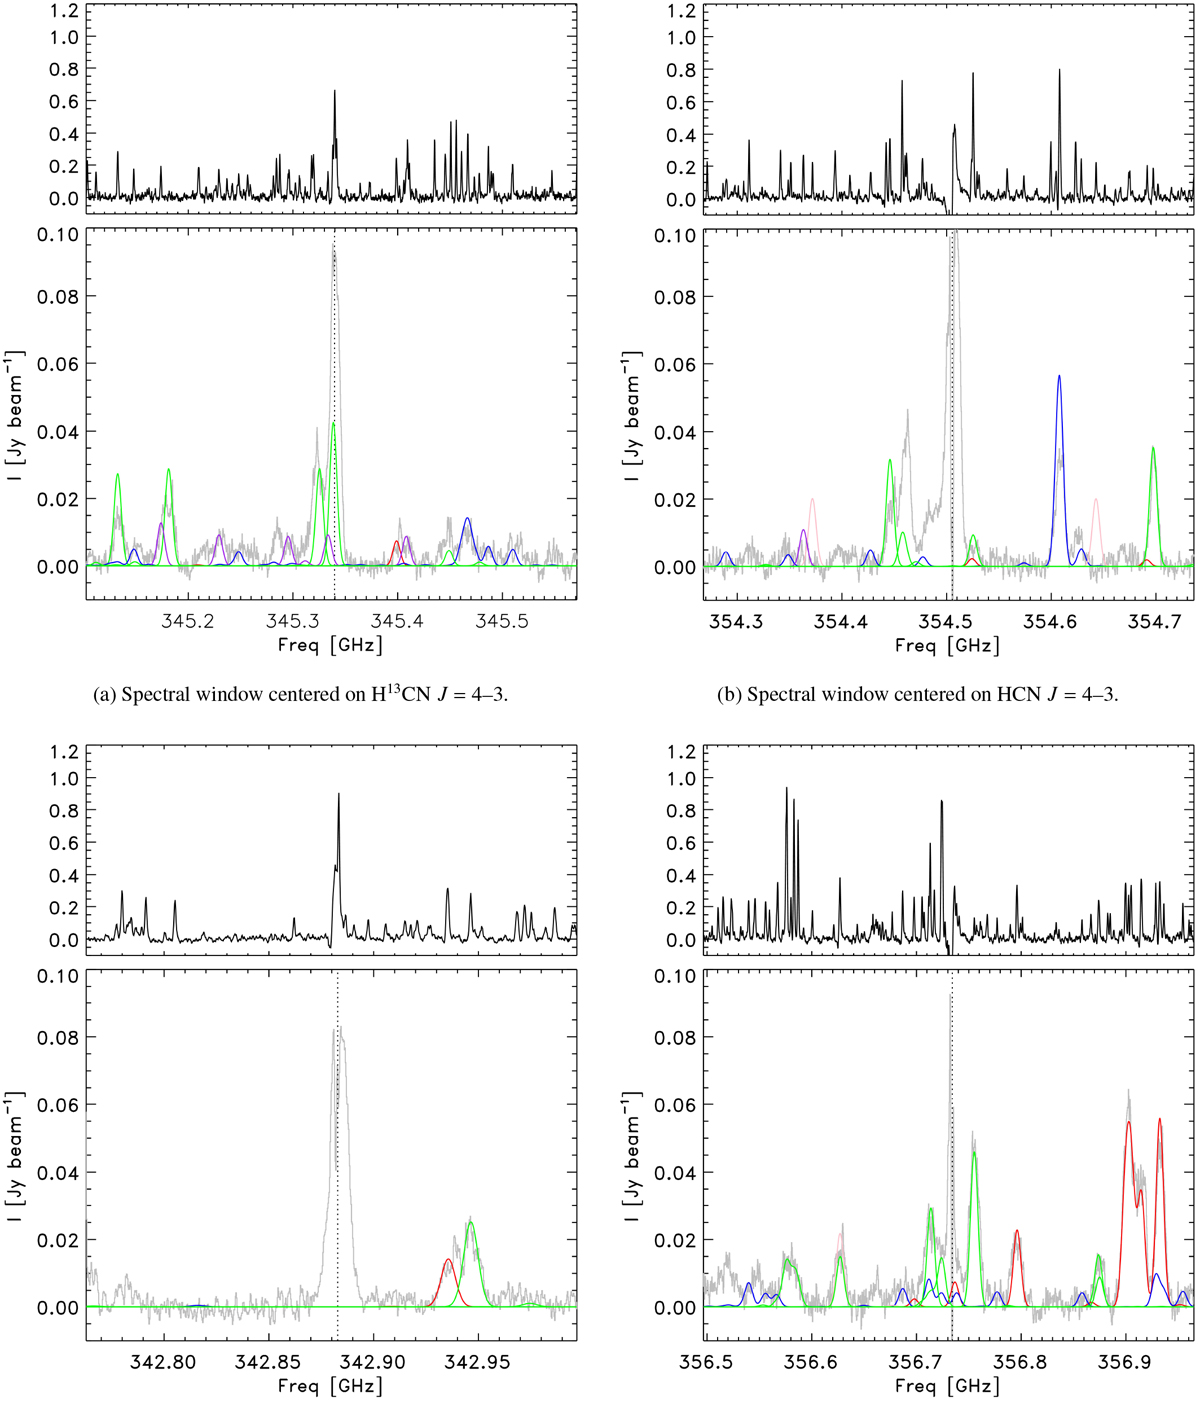
Cycle 3 spectral windows centered on H13CN J = 4–3, HCN J = 4–3, CS J = 7–6, and HCO+ J = 4–3. The main transition of the spectral window is shown as a dotted line, assuming vlsr = 5.4 km s−1. The line model fits are overlaid in colored lines (red = CH2DOH, blue = CH3OCHO, purple = C2H5OH, pink = CH3SH, green = all other species), while the observed spectrum is in gray. The top frames show the corresponding IRAS 16293B spectrum. The region from which the spectra was extracted can be seen in Figs. 4 and 5.
Current usage metrics show cumulative count of Article Views (full-text article views including HTML views, PDF and ePub downloads, according to the available data) and Abstracts Views on Vision4Press platform.
Data correspond to usage on the plateform after 2015. The current usage metrics is available 48-96 hours after online publication and is updated daily on week days.
Initial download of the metrics may take a while.