Fig. 4
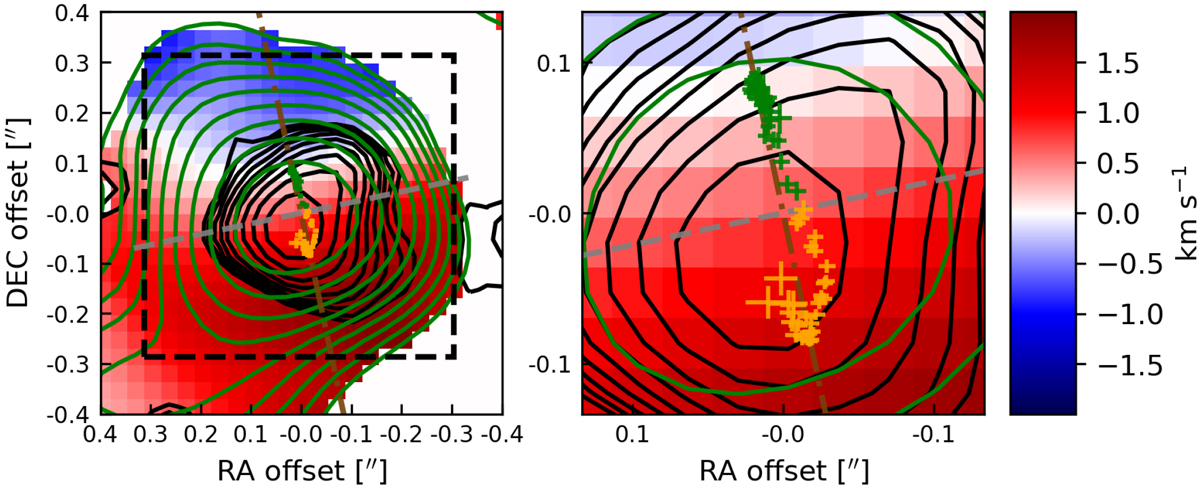
H13CN J = 4–3 imfit data points superimposed on the H13CN J = 4–3 moment 1 map. Green and orange points indicate blue- and redshifted channels, respectively. The width and height of the data symbols indicate the 1σ uncertainty of the peak position calculated by imfit. Green and black contours show the H13 CN J = 4–3 moment 0 map and 857 μm continuum emission, respectively, both spaced logarithmically between 5 and 100% of the peak emission, in 10 steps. The inferred rotation axis of H13CN J = 4–3 is shown asa gray dashed line and the velocity gradient vector as a brown dashed line. The emission center is the intersection between the rotation axis and the velocity vector. The black dashed box indicates the region used for the imfit routine and also shows the region from which the spectra in Fig. 6 were extracted. All the data shown in this figure are from the Cycle 3 dataset.
Current usage metrics show cumulative count of Article Views (full-text article views including HTML views, PDF and ePub downloads, according to the available data) and Abstracts Views on Vision4Press platform.
Data correspond to usage on the plateform after 2015. The current usage metrics is available 48-96 hours after online publication and is updated daily on week days.
Initial download of the metrics may take a while.