Fig. 3
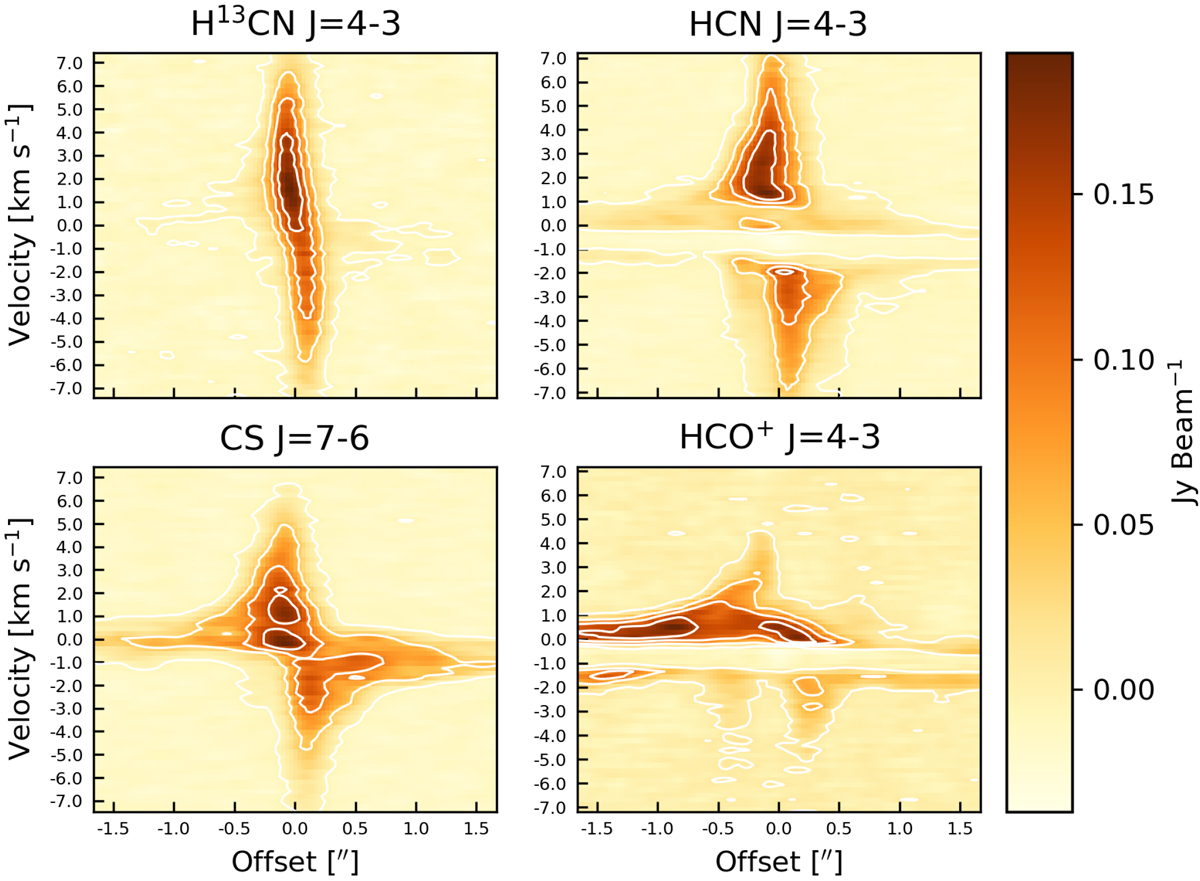
Position–velocity diagrams of H13CN J = 4–3, CS J = 7–6, HCN J = 4–3, and HCO+ J = 4–3, using vlsr = 6.0 km s−1. Contours are spaced linearly between 5 and 100% of the peak emission, in five steps. The PV diagrams are made along the direction of the velocity vector andthe offset is the distance to the rotation axis (Fig. 4). The emission center, as defined in Sect. 4, is the intersection of the rotation axis and velocity vector. The equation vlsr = 6.0 km s−1, derived in Sect. 4, matches the H13CN J = 4–3 emission well, while the large-scale emission seen in HCN J = 4–3, CS J = 7–6, and HCO+ J = 4–3 are better matched by 5.5 km−1 (Hatchell et al. 1999). All the data shown in this figure are from the combined dataset.
Current usage metrics show cumulative count of Article Views (full-text article views including HTML views, PDF and ePub downloads, according to the available data) and Abstracts Views on Vision4Press platform.
Data correspond to usage on the plateform after 2015. The current usage metrics is available 48-96 hours after online publication and is updated daily on week days.
Initial download of the metrics may take a while.