Fig. 2
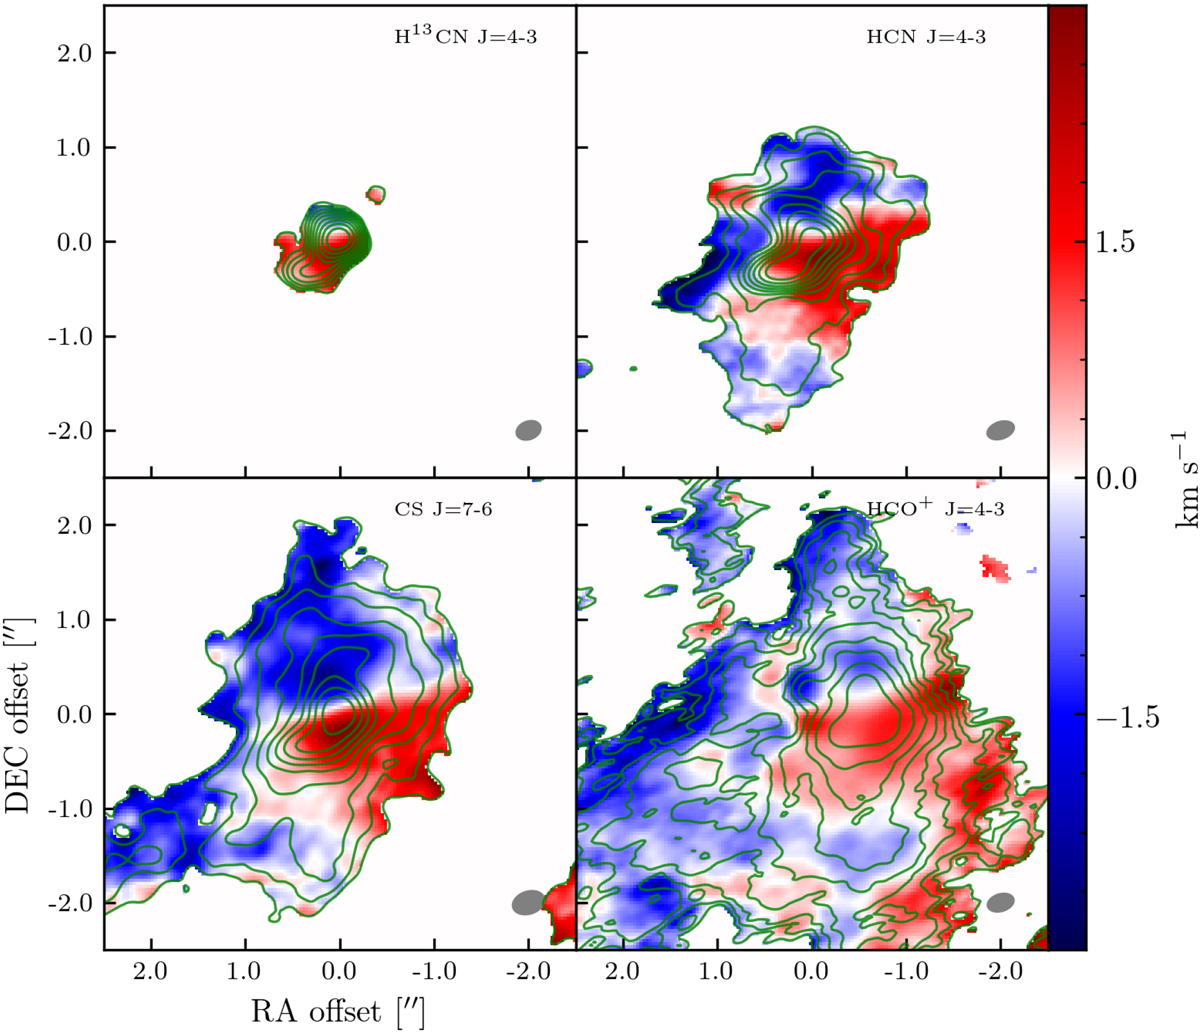
Moment 0 and 1 maps of H13CN J = 4–3, CS J = 7–6, HCN J = 4–3, and HCO+ J = 4–3. Moment 0 maps are shown in green contours, overlaid on the moment 1 maps. The moment 0 map contours are spaced logarithmically between 5 and 100% of the peak emission, in 10 steps. The peak emissions are 0.94, 1.2, 1.2, and 0.69 Jy Beam−1 km s−1 for H13 CN J = 4–3, CS J = 7–6, HCN J = 4–3, and HCO+ J = 4–3, respectively. The mean rms is 0.22 Jy Beam−1 km s−1. All the datashown in this figure are from the combined dataset.
Current usage metrics show cumulative count of Article Views (full-text article views including HTML views, PDF and ePub downloads, according to the available data) and Abstracts Views on Vision4Press platform.
Data correspond to usage on the plateform after 2015. The current usage metrics is available 48-96 hours after online publication and is updated daily on week days.
Initial download of the metrics may take a while.