Fig. 10
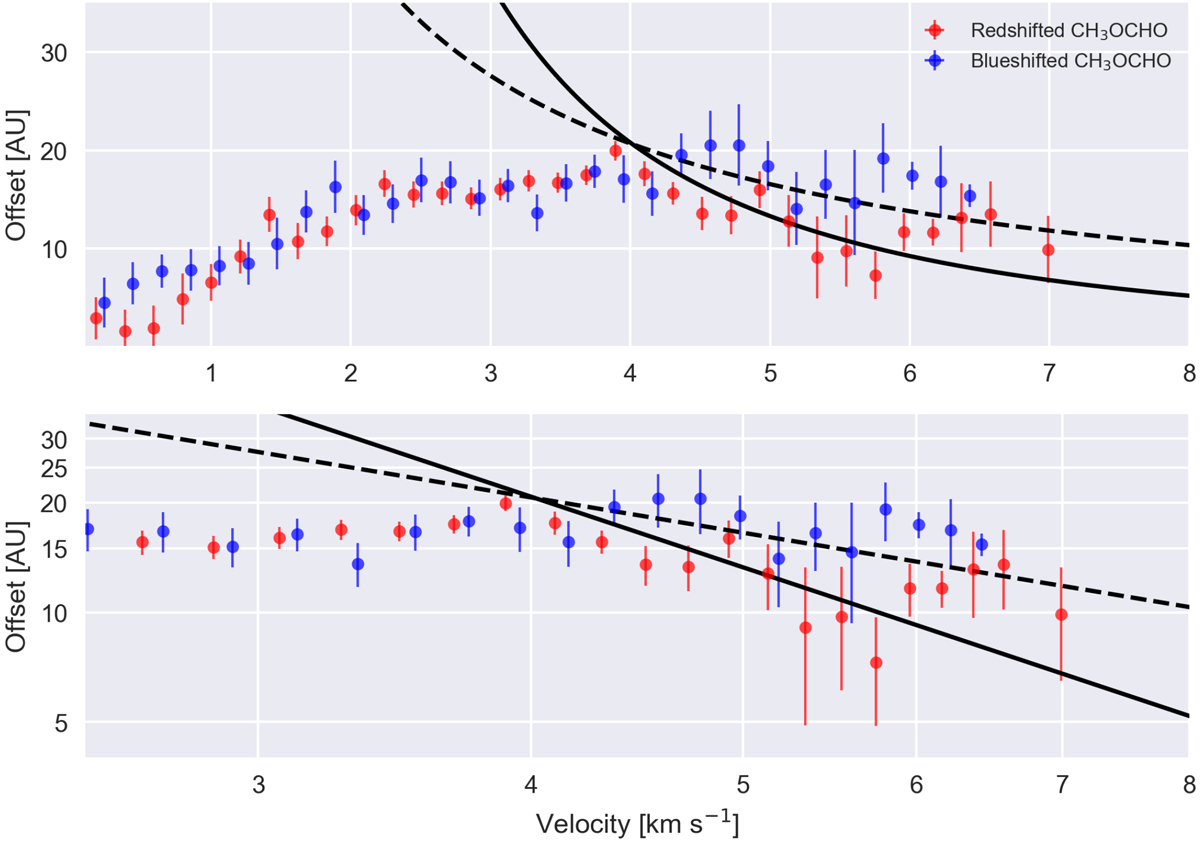
Distance vs. velocity plot of CH3OCHO imfit data points, using Cycle 3 data only, in linear scale (top frame) and logscale (bottom frame). The velocities on the first axis are the velocity offset from the employed systemic velocity (6.0 km s−1). The blue- and redshifted imfit data points of the CH3OCHO emission areshown in blue and red, respectively. The data diverging from the model velocity profiles at low velocities, below ~ 4 km s−1, arise from the projected rotational gas motions at the edge of the emission region. Both frames are overlaid with the best fit infall (dashed line) and Keplerian velocity profile (full line) to the Cycle 3 CS J = 7–6 and H13CN J = 4–3 data.
Current usage metrics show cumulative count of Article Views (full-text article views including HTML views, PDF and ePub downloads, according to the available data) and Abstracts Views on Vision4Press platform.
Data correspond to usage on the plateform after 2015. The current usage metrics is available 48-96 hours after online publication and is updated daily on week days.
Initial download of the metrics may take a while.