Fig. 5
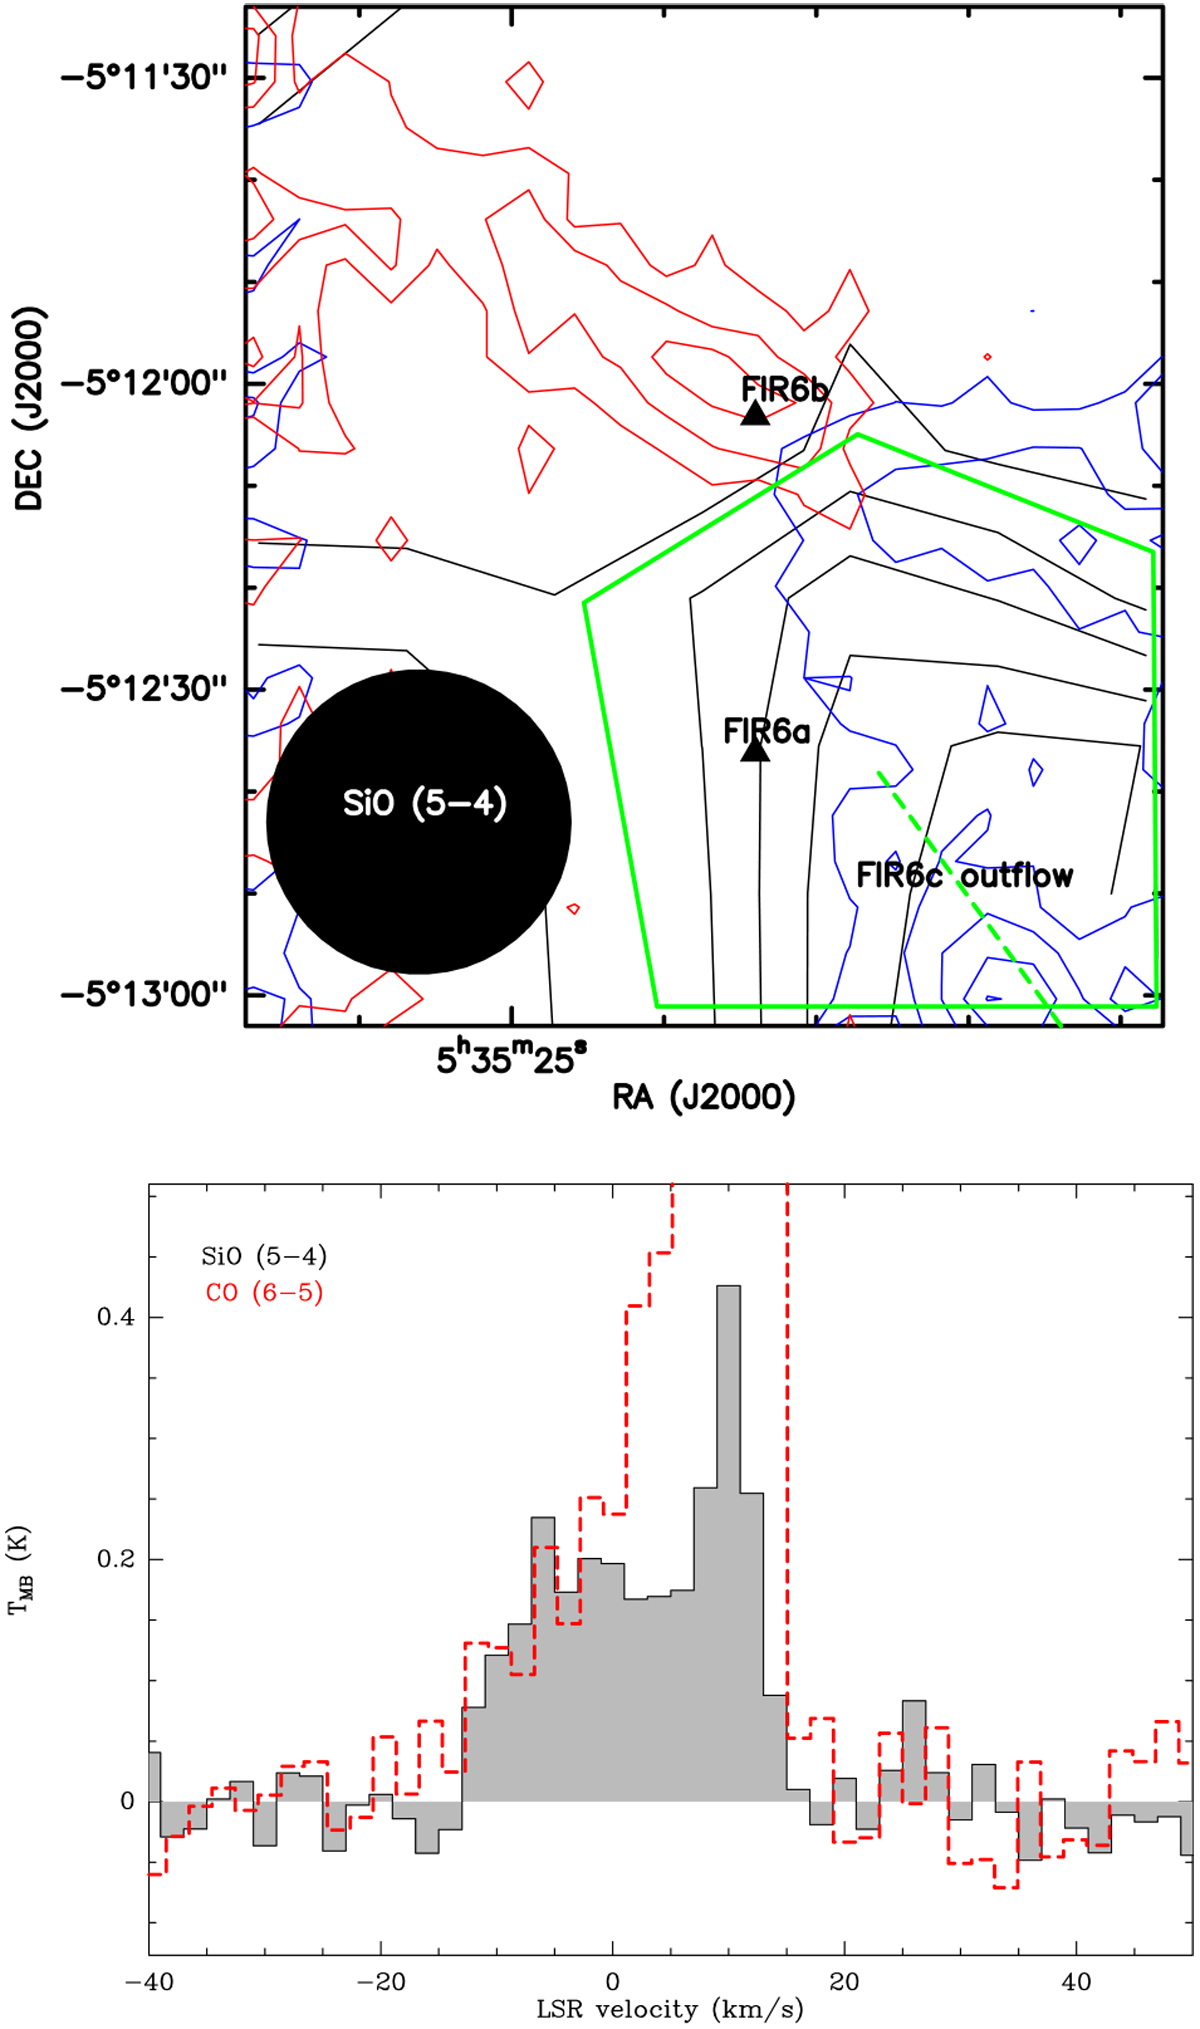
Upper panel: SiO (5–4) map of the FIR 6 region, integrated from −12 to 15 km s−1 (black contours), overlaid with the CO (6–5) outflow emission (blue and red contours; as in Fig. 1). The SiO contour step is 3σ, with the firstcontour at 3σ (σ = 0.38 K km s−1). Lower panel: SiO (5–4) spectrum (black) averaged over the region indicated by the green polygon on the top panel. To increase the signal-to-noise ratio the spectral resolution was smoothed to 2 km s−1. As comparison the CO (6–5) spectrum is shown in red.
Current usage metrics show cumulative count of Article Views (full-text article views including HTML views, PDF and ePub downloads, according to the available data) and Abstracts Views on Vision4Press platform.
Data correspond to usage on the plateform after 2015. The current usage metrics is available 48-96 hours after online publication and is updated daily on week days.
Initial download of the metrics may take a while.