Fig. 5.
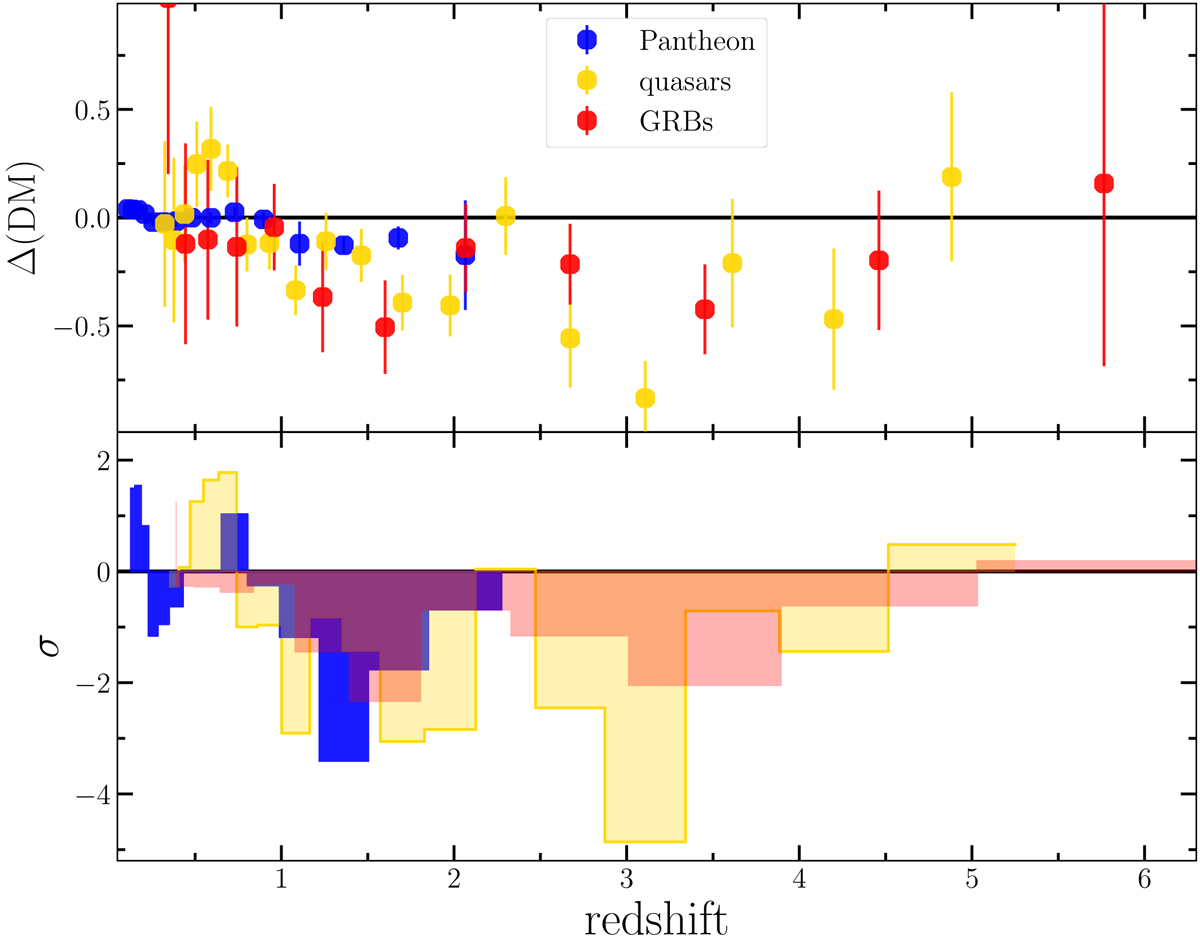
Deviation of the distance modulus from the ΛCDM with ΩM = 0.3 and normalized to the Pantheon SNe sample up to z = 1 (Δ(DM) = DM−DMΛCDM) for SNe Ia (blue), quasars (yellow), and GRBs (red). Top panel: Points represent the averages of Δ(DM) in logarithmic redshift intervals. Bottom panel: Deviations in σ. We note that the statistical significance of the discrepancy from the ΛCDM in Fig. 4 is not directly comparable to the one plotted here since the MCMC fits in the former are computed over the entire redshift range.
Current usage metrics show cumulative count of Article Views (full-text article views including HTML views, PDF and ePub downloads, according to the available data) and Abstracts Views on Vision4Press platform.
Data correspond to usage on the plateform after 2015. The current usage metrics is available 48-96 hours after online publication and is updated daily on week days.
Initial download of the metrics may take a while.