Fig. 4.
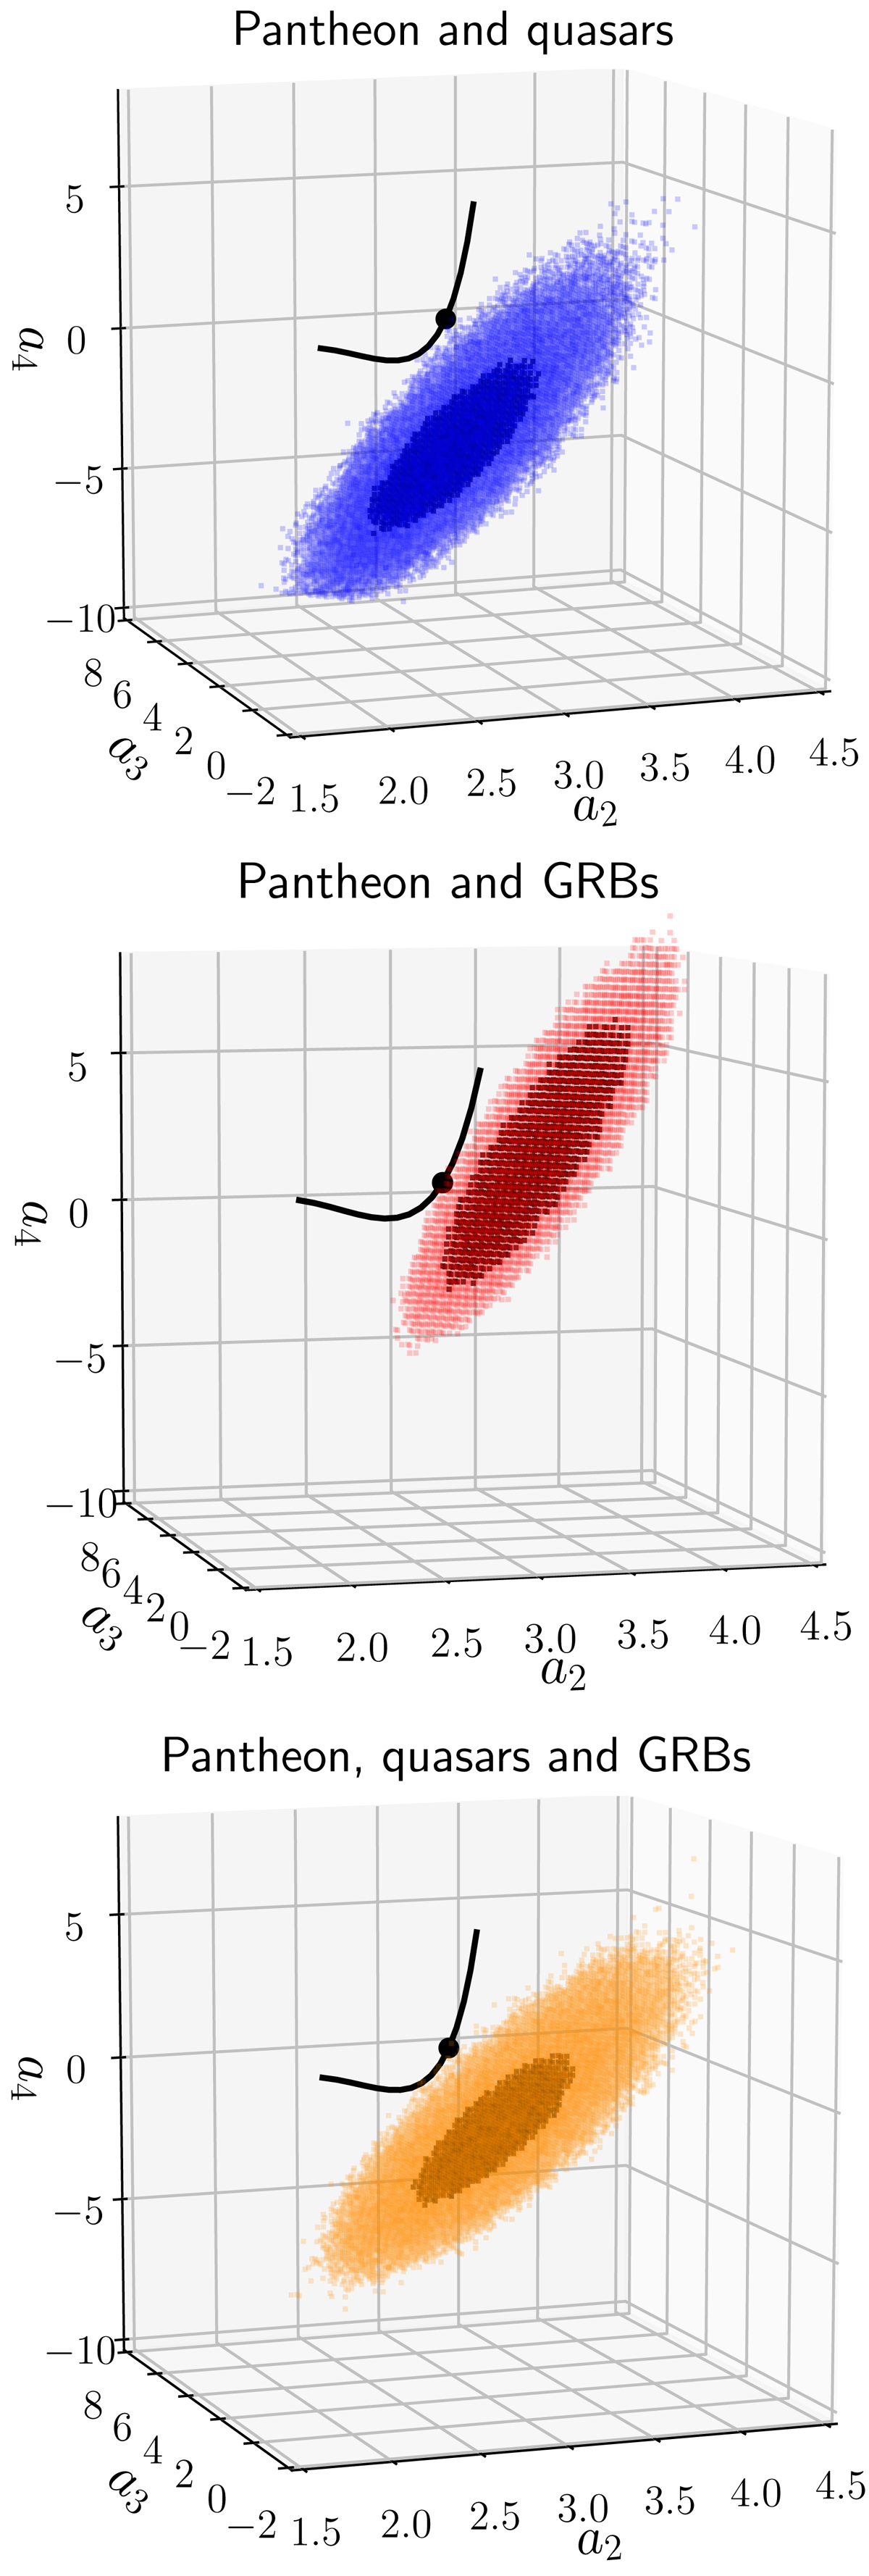
1σ (dark colours) and 4σ (light colours) error contours in the (a2, a3, a4) parameter space resulting from fitting the data using Eq. (8) for the samples Pantheon+quasars and Pantheon+quasars+GRBs. We plot the 1σ and 2σ error contours for the Pantheon+GRBs. The black solid line represents a flat ΛCDM model with ΩM in the interval 0.1–0.9, where the black point marks the value ΩM = 0.3 (i.e. Eqs. (9)–(11)). From top to bottom: result from the cosmographic technique described in Sects. 3.2 and 4.2.
Current usage metrics show cumulative count of Article Views (full-text article views including HTML views, PDF and ePub downloads, according to the available data) and Abstracts Views on Vision4Press platform.
Data correspond to usage on the plateform after 2015. The current usage metrics is available 48-96 hours after online publication and is updated daily on week days.
Initial download of the metrics may take a while.