Fig. 2.
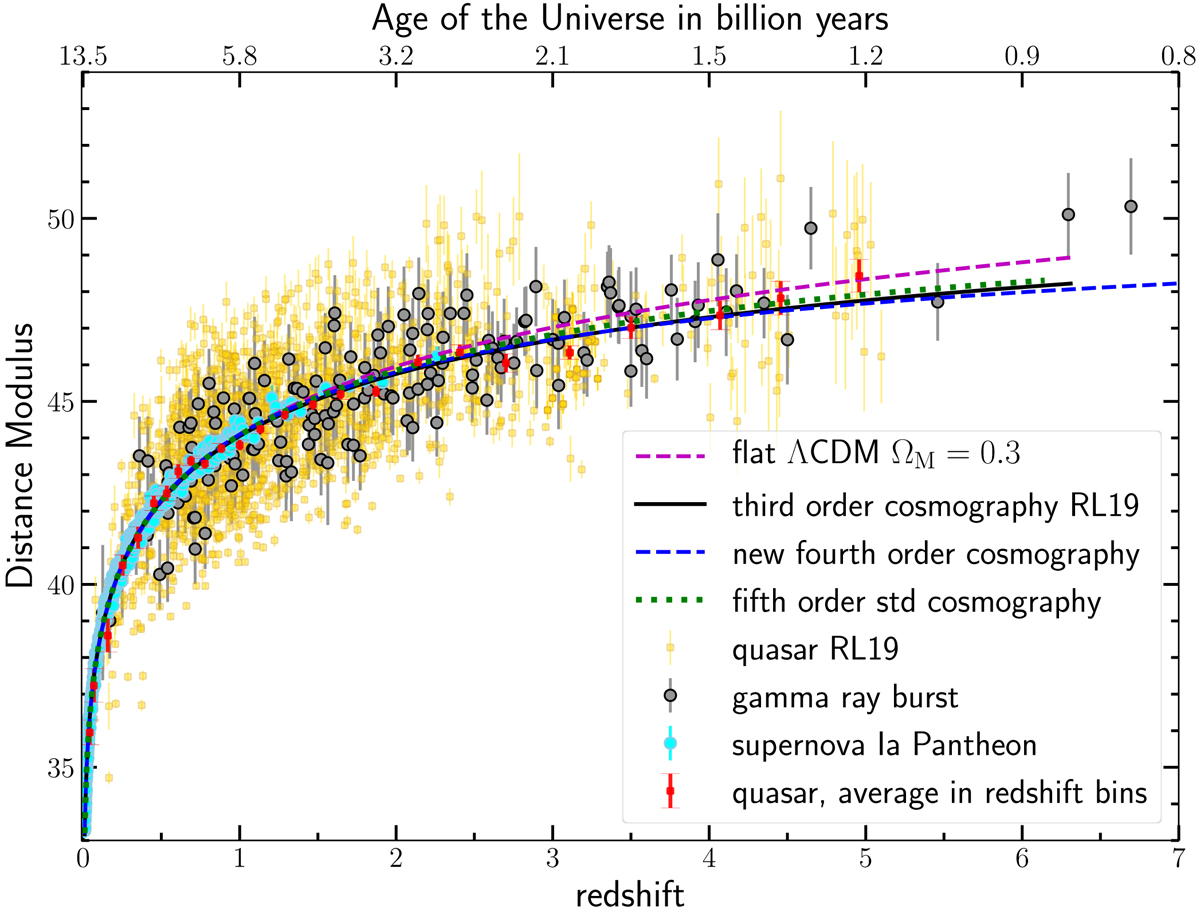
Hubble diagram of SNe Ia (cyan points), quasars (yellow points), and GRBs (black points) with the 1σ uncertainties. Red points are the mean (also with 1σ uncertainties) of the distance modulus in narrow redshift bins for quasars only (shown for visualisation purposes). The dashed magenta line shows a flat ΛCDM model fit with ΩM = 0.3. The green dotted line is the best MCMC fit using the standard cosmographic approach (Sect. 3.1) with the inclusion of GRBs and Pantheon, whilst the blue dot-dashed line represents the new regression fit (Sect. 3.2). The black solid line is the best MCMC regression curve of the third-order expansion of log(1 + z) published by RL19 and obtained by fitting the quasars and the SNe Ia from the JLA survey (Betoule et al. 2014).
Current usage metrics show cumulative count of Article Views (full-text article views including HTML views, PDF and ePub downloads, according to the available data) and Abstracts Views on Vision4Press platform.
Data correspond to usage on the plateform after 2015. The current usage metrics is available 48-96 hours after online publication and is updated daily on week days.
Initial download of the metrics may take a while.