Fig. 5.
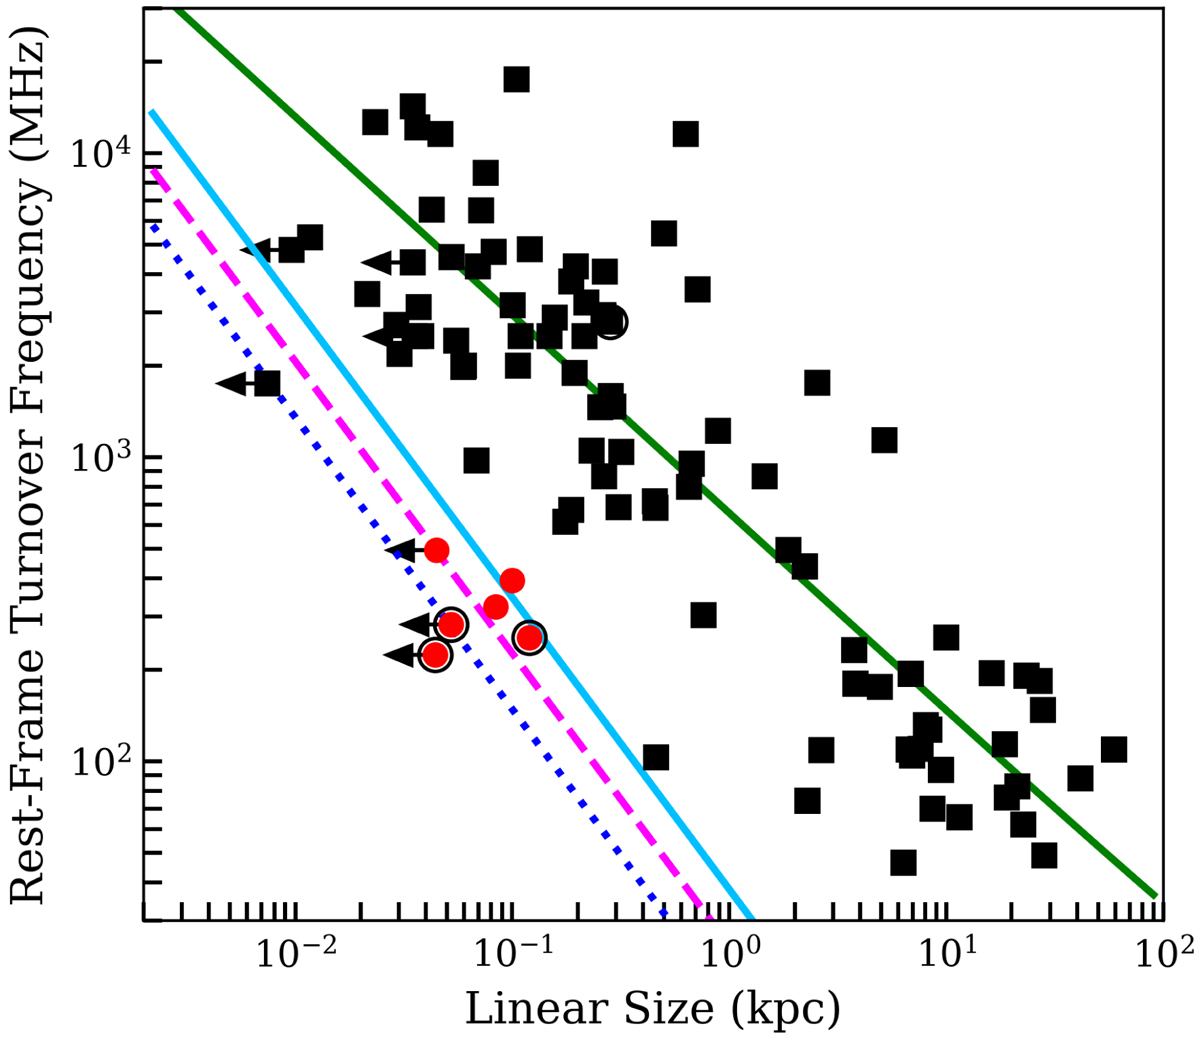
Turnover frequency, linear size relationship for both our sources and those described in Table A.1 with different FFA model parameters. The light blue solid line, the magenta dashed line, and the dark blue dotted line represent FFA models where E = 1043, 1042.5, and 1042 ergs s−1, respectively, δ = 2, and n0 reaches 0.1 cm−3 at 1 kpc, which well describe our sources. The green line represents the required FFA model from Bicknell et al. (1997) to replicate the power-law slope from Eq. (5), where δ = −0.75, n0 = 100 cm−3 and E = 1045.5 ergs s−1. Red circles represent our sources, black squares represent sources listed in Table A.1, arrows indicate maximum linear sizes for unresolved sources, and black circles indicate sources with unknown redshifts (set to 1 for this plot).
Current usage metrics show cumulative count of Article Views (full-text article views including HTML views, PDF and ePub downloads, according to the available data) and Abstracts Views on Vision4Press platform.
Data correspond to usage on the plateform after 2015. The current usage metrics is available 48-96 hours after online publication and is updated daily on week days.
Initial download of the metrics may take a while.