Fig. 4.
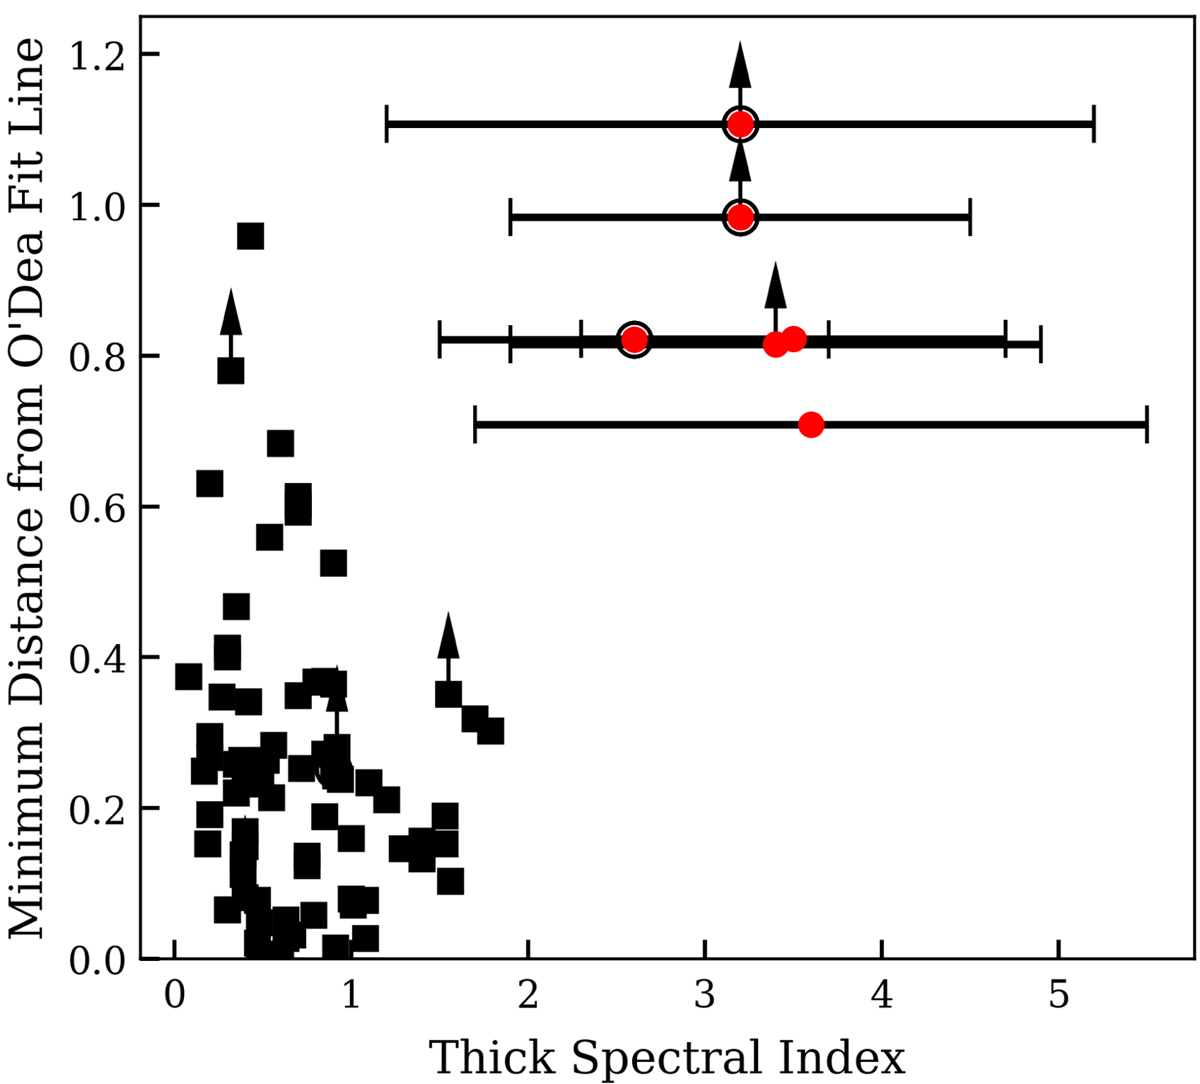
Minimum distance to Eq. (5) for each source as calculated in log space (see Eq. (6)). Red circles represent our sources while black squares represent literature sources listed in Table A.1. Arrows indicate lower limits for unresolved sources and black circles indicate sources with unknown redshifts (set to 1 for this plot). Note that the thick spectral indices of our sources with spectral peaks between 72 and 230 MHz are less reliable since their spectra were only sampled at < 12 frequencies below the spectral turnover.
Current usage metrics show cumulative count of Article Views (full-text article views including HTML views, PDF and ePub downloads, according to the available data) and Abstracts Views on Vision4Press platform.
Data correspond to usage on the plateform after 2015. The current usage metrics is available 48-96 hours after online publication and is updated daily on week days.
Initial download of the metrics may take a while.