Fig. 3.
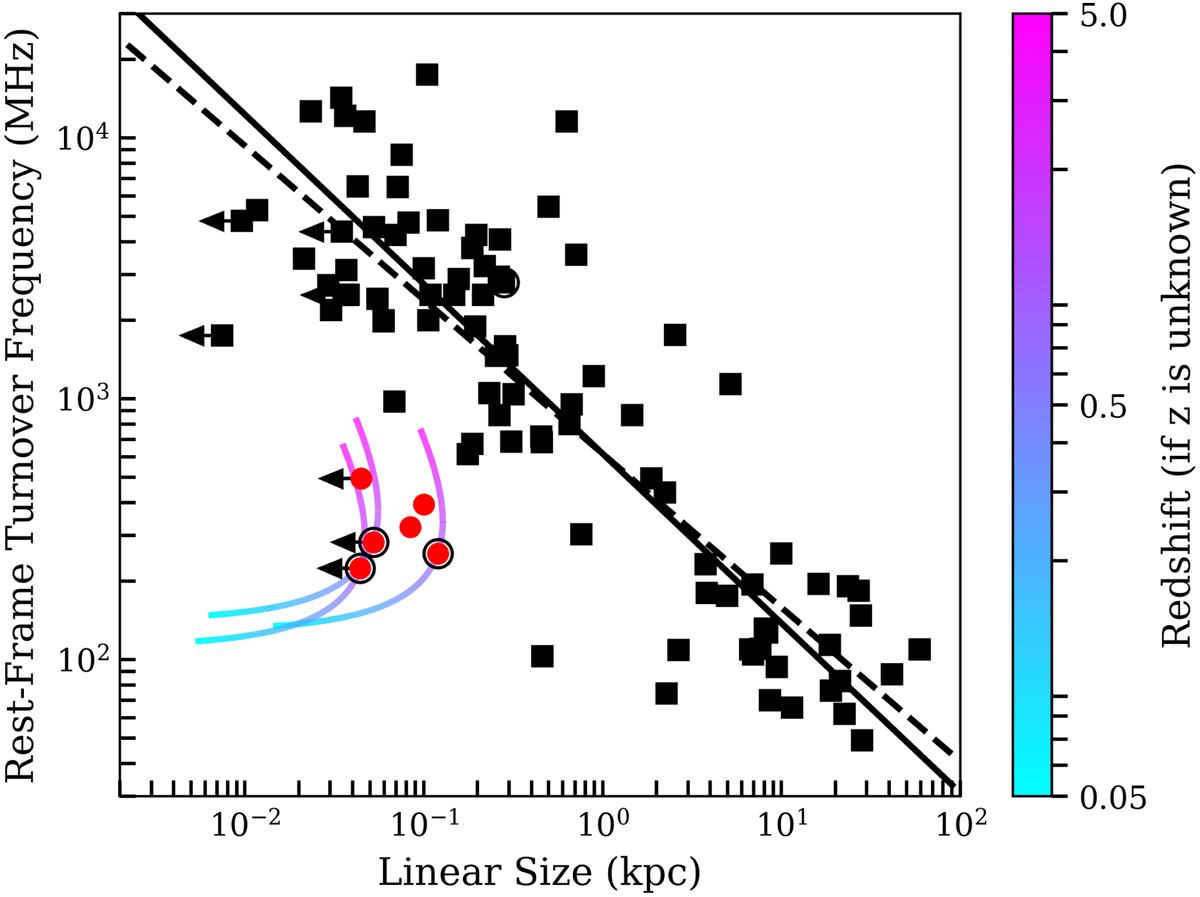
Rest-frame turnover frequency versus linear size for our sources and those described in Appendix A. Red circles represent our sources while black squares represent sources from prior literature listed in Table A.1. The solid line represents Eq. (5), the dashed line represents the similar relation found by Orienti & Dallacasa (2014), arrows indicate maximum linear sizes for unresolved sources, and black circles indicate sources with unknown redshifts (set to 1 for this plot). For sources with unknown redshifts, colored lines are included to demonstrate the redshift dependence, with z specified by the color-bar.
Current usage metrics show cumulative count of Article Views (full-text article views including HTML views, PDF and ePub downloads, according to the available data) and Abstracts Views on Vision4Press platform.
Data correspond to usage on the plateform after 2015. The current usage metrics is available 48-96 hours after online publication and is updated daily on week days.
Initial download of the metrics may take a while.