Fig. 2.
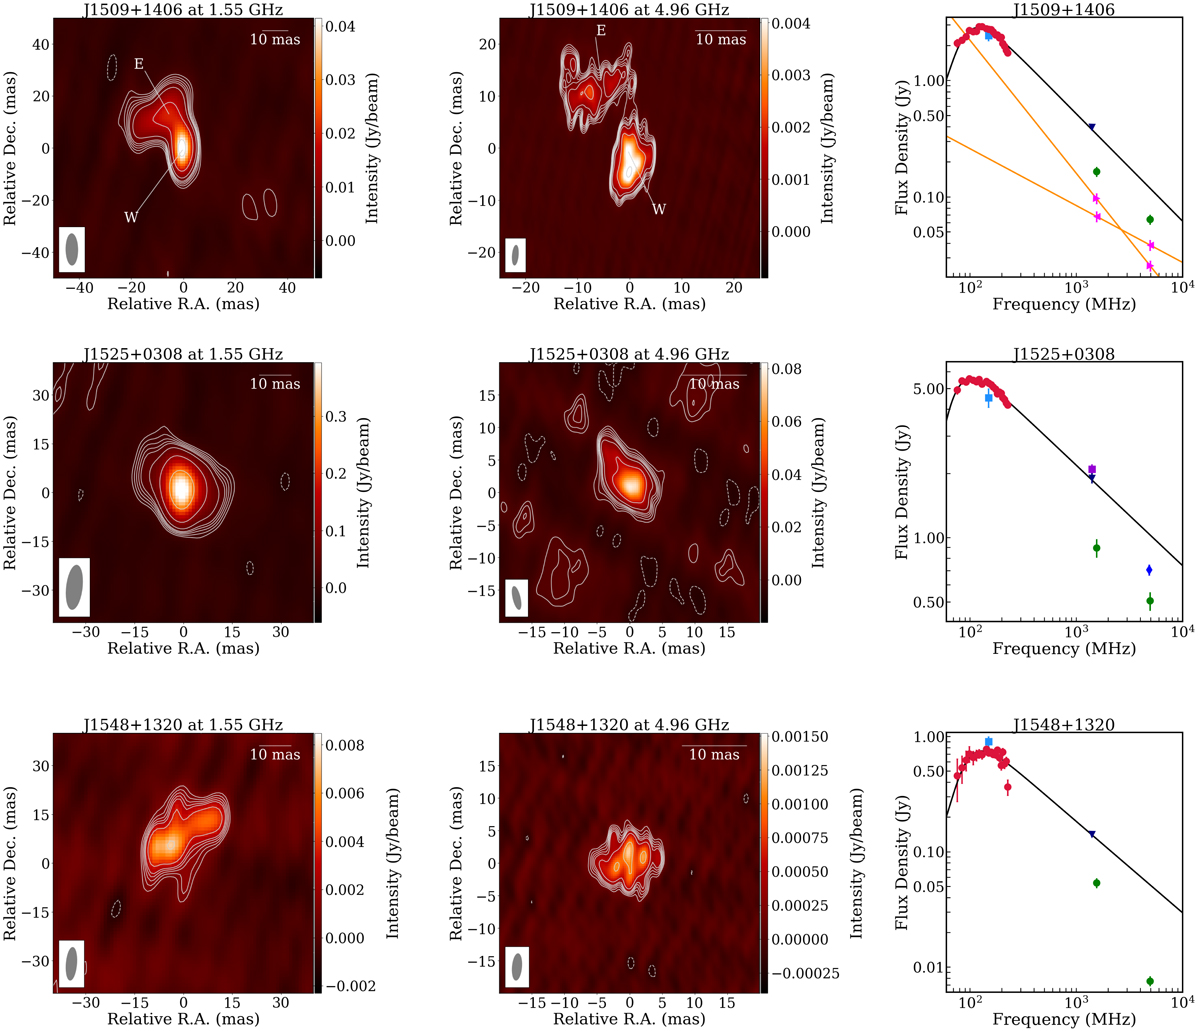
VLBA images at 1.55 GHz (left) and 4.96 GHz (middle) of sources with peaks between 72 and 230 MHz and associated spectra (right). The Stokes I images have beam sizes and position angles as specified in Table 2, with axes given in relative offset from RA and Dec coordinates reported in Table 1. Contours are placed at (−3, 3, 4, 5, 6, 7, 10, 20, 50, 100, 200, 400, 800, 1600) ×σ (with σ given in Table 2). Color is given in a linear scale as indicated by color-bars to the right of the images. Where source components are resolved, Eastern and Western components are labeled as “E” and “W” at the same RA and Dec for both images based on component peak locations at 4.96 GHz. Spectra include data from GLEAM in red circles, TGSS-ADR1 in blue squares, NVSS in navy downward-pointing triangles, FIRST in dark violet squares, and PMN in dark blue diamonds. Integrated flux densities from associated VLBA images are included as green circles, and, where sources are resolved, Eastern and Western components are included as right and left pointing magenta triangles, respectively. The black curve indicates the fit of a generic curve to GLEAM, TGSS-ADR1, and NVSS data. Where sources are resolved at both frequencies, orange lines represent the resulting power-law for each component.
Current usage metrics show cumulative count of Article Views (full-text article views including HTML views, PDF and ePub downloads, according to the available data) and Abstracts Views on Vision4Press platform.
Data correspond to usage on the plateform after 2015. The current usage metrics is available 48-96 hours after online publication and is updated daily on week days.
Initial download of the metrics may take a while.