Fig. 7
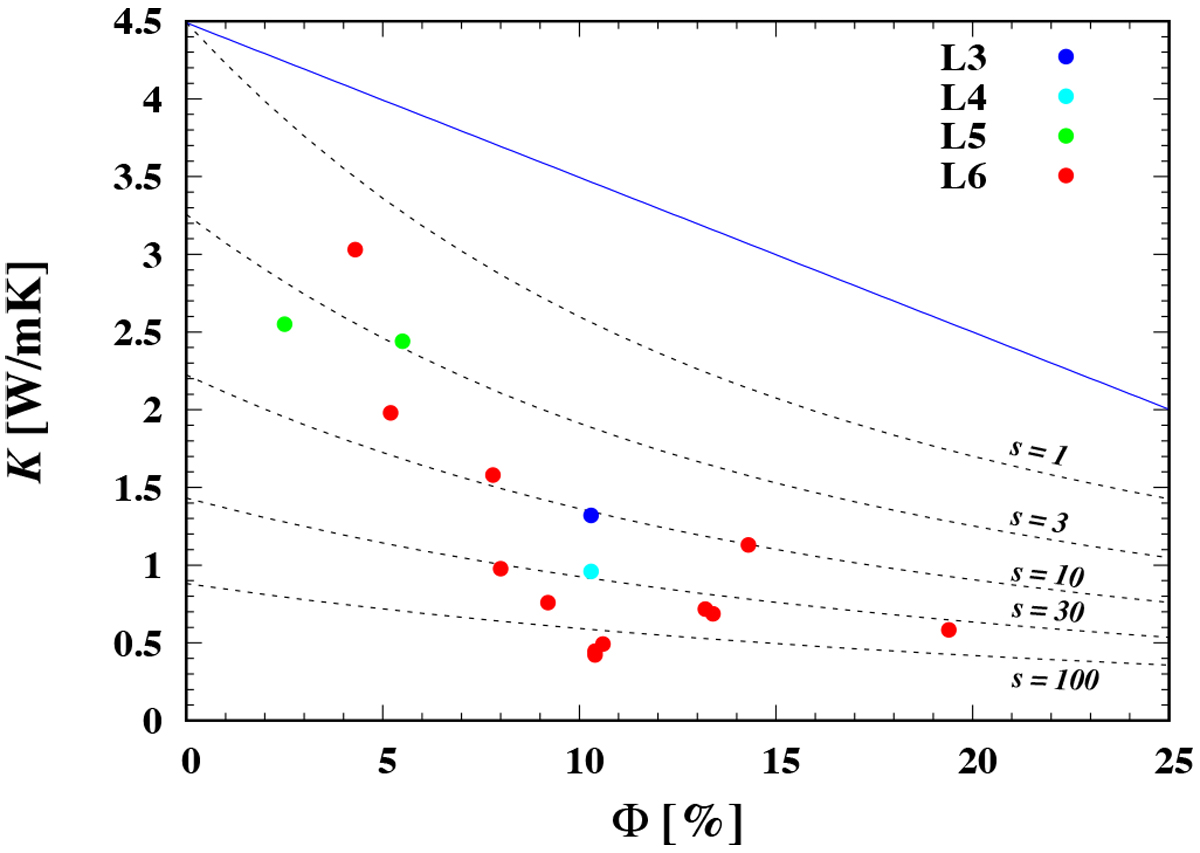
Measured heat conductivities and porosities of L chondrites at 300 K (Yomogida & Matsui 1983; Opeil et al. 2010, 2012) for which both quantities have been measured. The dashed lines correspond to the heat conductivity according to the conduction model (Appendix A.4) for a porous material with abundant micro-cracks. The indicated values correspond to the reduction factor, s, for phonon scattering length. The blue line correspond to the heat conductivity of a sand-stone like porous material according to Eq. (A.4).
Current usage metrics show cumulative count of Article Views (full-text article views including HTML views, PDF and ePub downloads, according to the available data) and Abstracts Views on Vision4Press platform.
Data correspond to usage on the plateform after 2015. The current usage metrics is available 48-96 hours after online publication and is updated daily on week days.
Initial download of the metrics may take a while.