Fig. 4
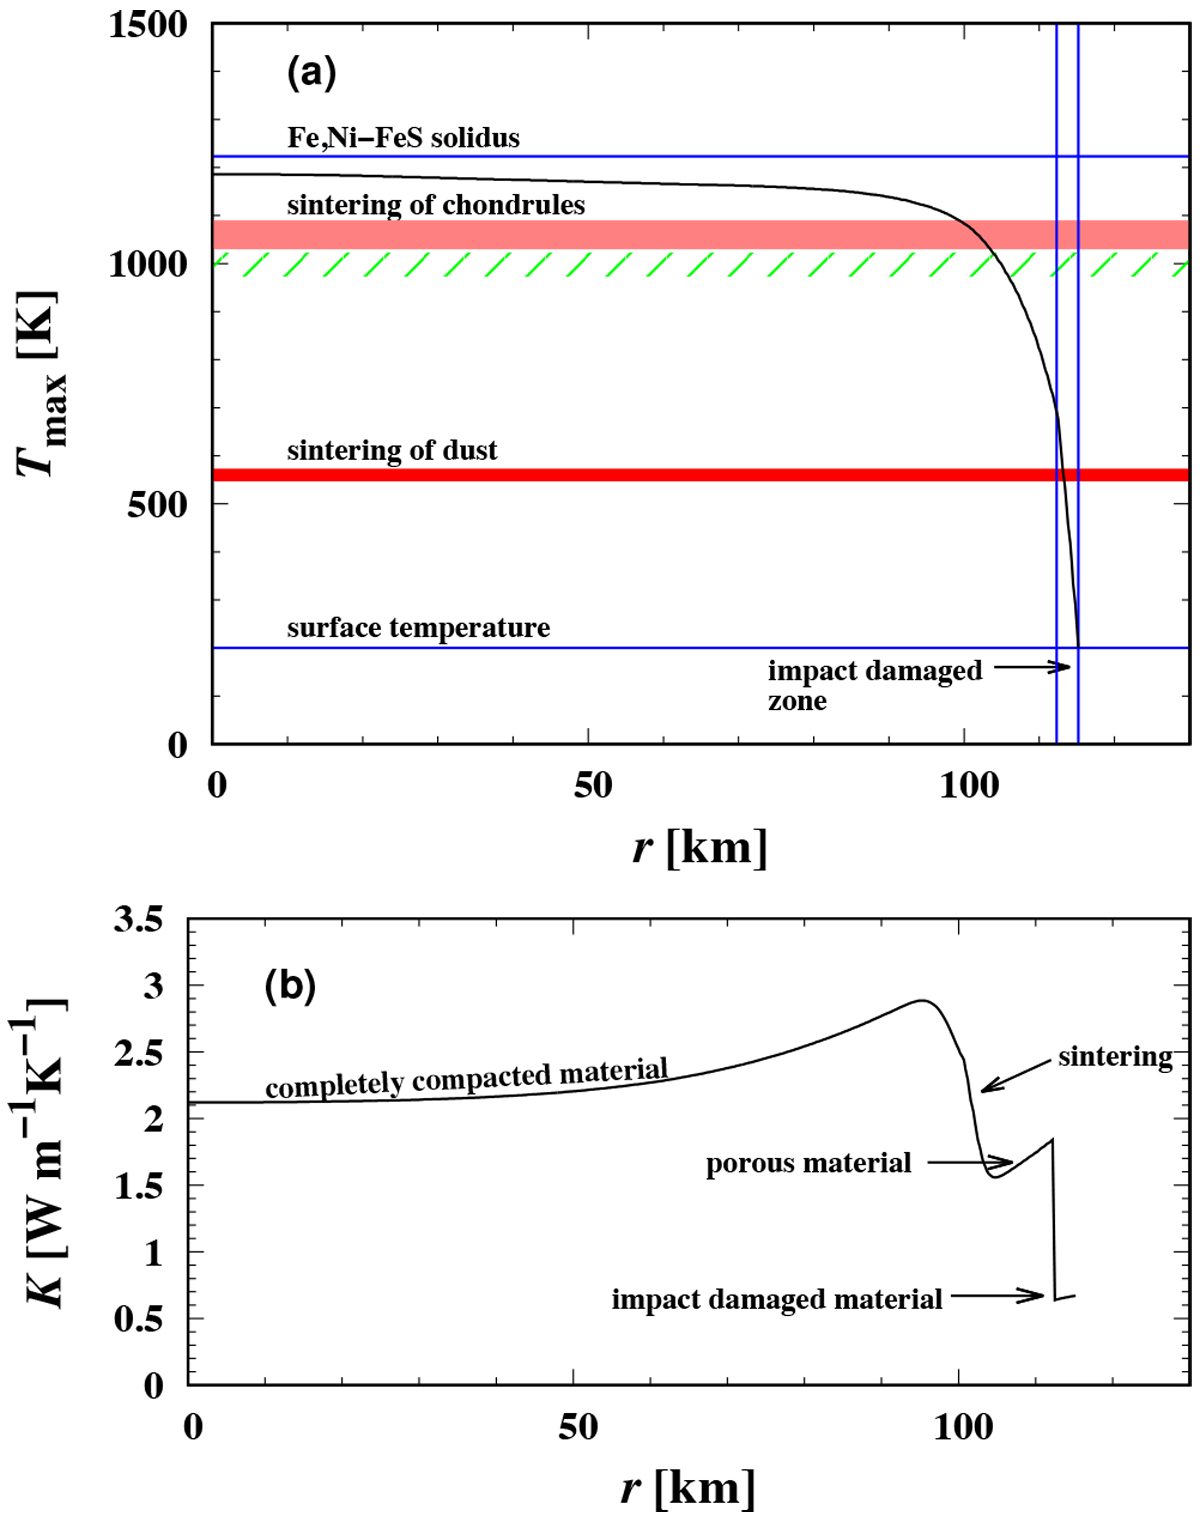
Radial variation of maximum metamorphic temperature and heat conductivity. (a) Maximum of temperature at radius r during the undisturbed thermal evolution of the body (black line) for model LM2. The two broad red strips indicate thetemperature range over which the chondrule assembly (upper strip) and the initially fine-grained matrix material (lower strip) are compacted. The hatched area is the temperature range between the upper metamorphic temperatures of L4 and of L5 chondrites (973 to 1023 K, respectively, according to McSween et al. 1988) where the inter-granular voids between chondrules disappear. The upper blue line shows the eutectic melting temperature of 1223 K for the Ni,Fe-FeS system at the Ni content of L chondrites. (b) Radial variation of the heat conductivity K at 30 Ma after formation of the body.
Current usage metrics show cumulative count of Article Views (full-text article views including HTML views, PDF and ePub downloads, according to the available data) and Abstracts Views on Vision4Press platform.
Data correspond to usage on the plateform after 2015. The current usage metrics is available 48-96 hours after online publication and is updated daily on week days.
Initial download of the metrics may take a while.