Fig. 2
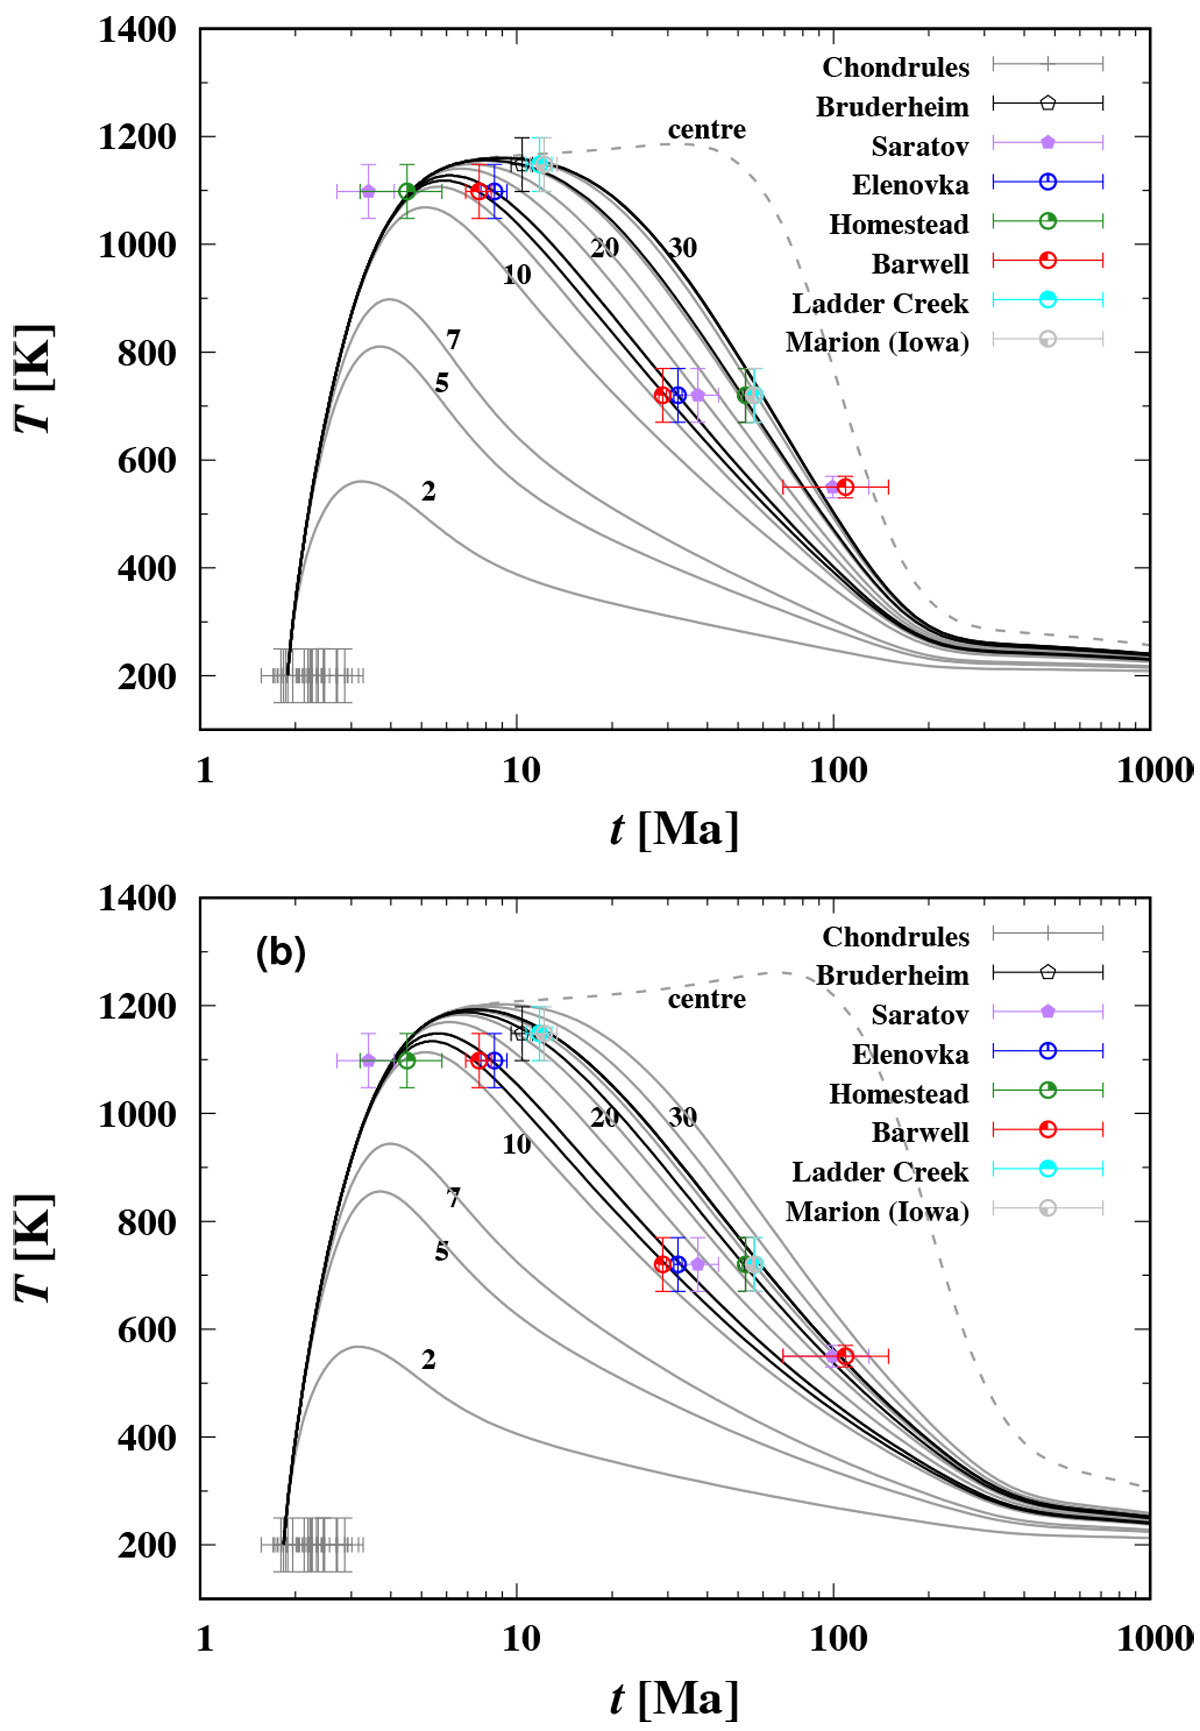
Temperature evolution at different depths below the surface (grey lines) and evolution of the central temperature (dashed grey line). The symbols with error bars correspond to the closure temperatures and closure times of L chondrites. The black lines correspond to the temperature evolution at the burial depths of the five meteorites from Table 6 for model LM2 (a) and model LM3 (b). The data of Homestead and Saratov are not used for the optimisation. Grey dots show chondrule ages for L chondrites from Pape et al. (2019).
Current usage metrics show cumulative count of Article Views (full-text article views including HTML views, PDF and ePub downloads, according to the available data) and Abstracts Views on Vision4Press platform.
Data correspond to usage on the plateform after 2015. The current usage metrics is available 48-96 hours after online publication and is updated daily on week days.
Initial download of the metrics may take a while.