Fig. 4
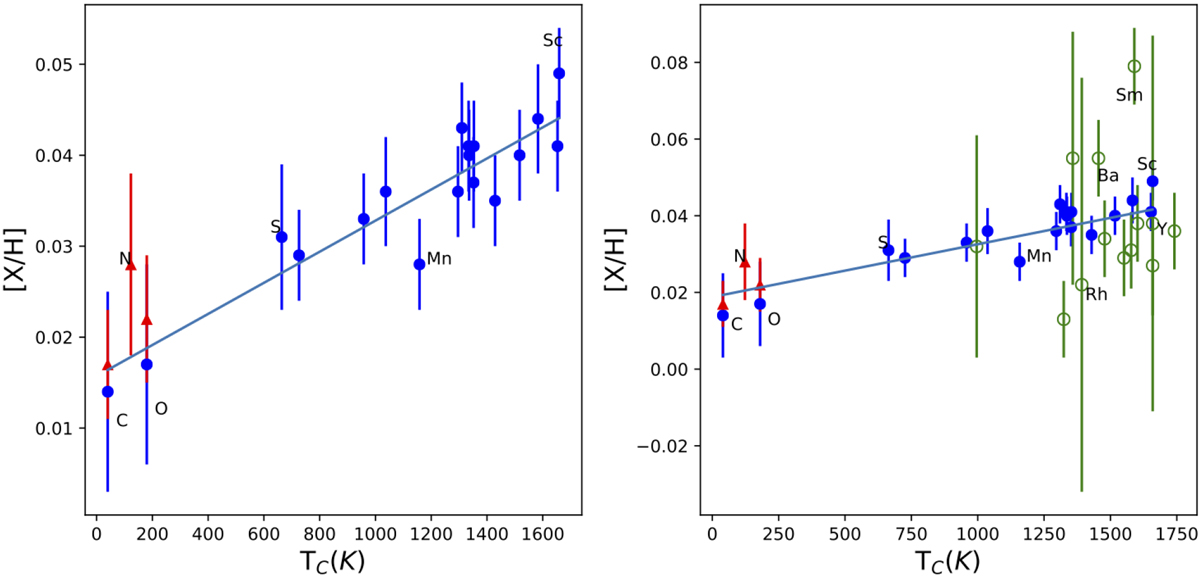
Differential abundances (manually measured) of (A – B) as a function of Tc for elements with Z ≤ 30 (left panel) also adding the neutron-capture elements (right panel). The red triangles correspond to the molecule-based abundances of C, N, and O. The slope found is 1.56 ± 0.24 × 10⁻⁵ dex K−1 based on the fit to the elements with Z ≤ 30.
Current usage metrics show cumulative count of Article Views (full-text article views including HTML views, PDF and ePub downloads, according to the available data) and Abstracts Views on Vision4Press platform.
Data correspond to usage on the plateform after 2015. The current usage metrics is available 48-96 hours after online publication and is updated daily on week days.
Initial download of the metrics may take a while.