Fig. A.1.
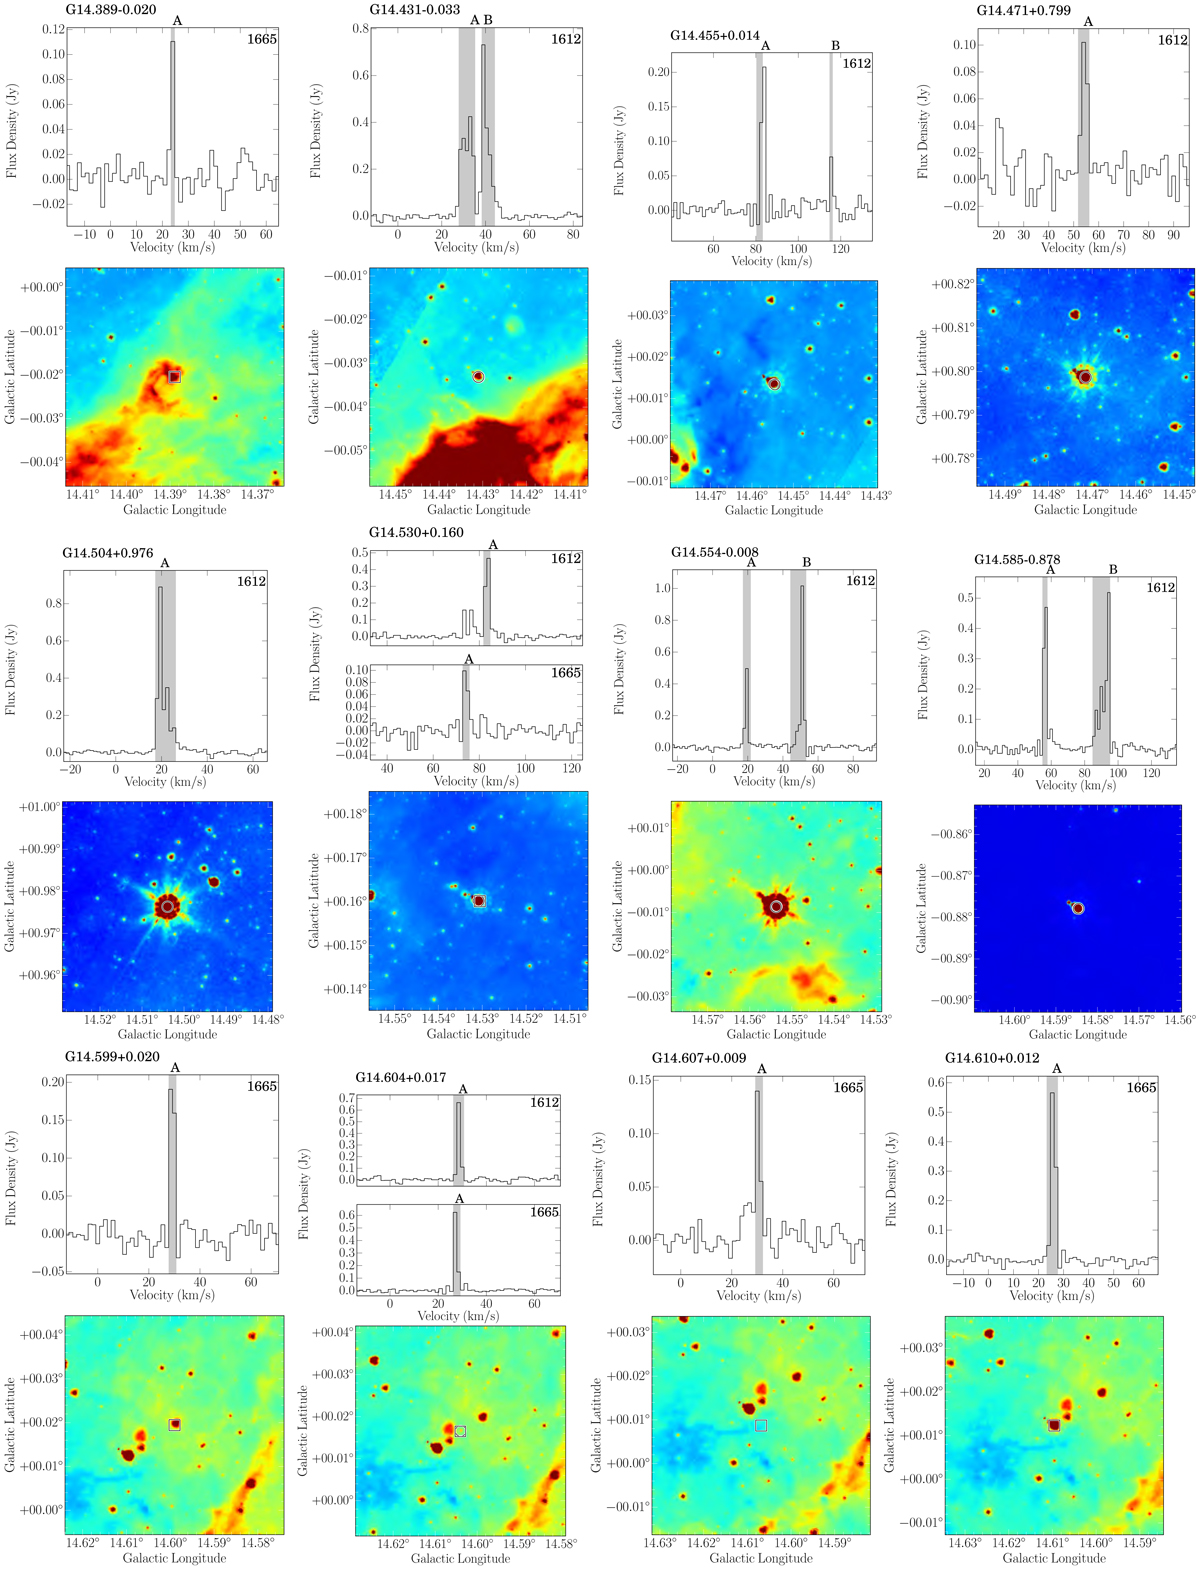
Individual OH spectra and 8 μm images. For each maser site, the top panels show the spectrum/spectra identified in this region, and the bottom panels present the corresponding GLIMPSE 8 μm image (Benjamin et al. 2003; Churchwell et al. 2009). Where GLIMPSE data are not available, the corresponding WISE data (Wright et al. 2010) are used. The grey-shaded parts in the spectra outline the velocity regimes of the individual maser spots, and the circles, squares, diamonds, and plus-signs mark the positions of the 1612, 1665, 1667, and 1720 MHz maser spots, respectively (spatially overlapping ones are sometimes difficult to visually separate).
Current usage metrics show cumulative count of Article Views (full-text article views including HTML views, PDF and ePub downloads, according to the available data) and Abstracts Views on Vision4Press platform.
Data correspond to usage on the plateform after 2015. The current usage metrics is available 48-96 hours after online publication and is updated daily on week days.
Initial download of the metrics may take a while.