Fig. 4.
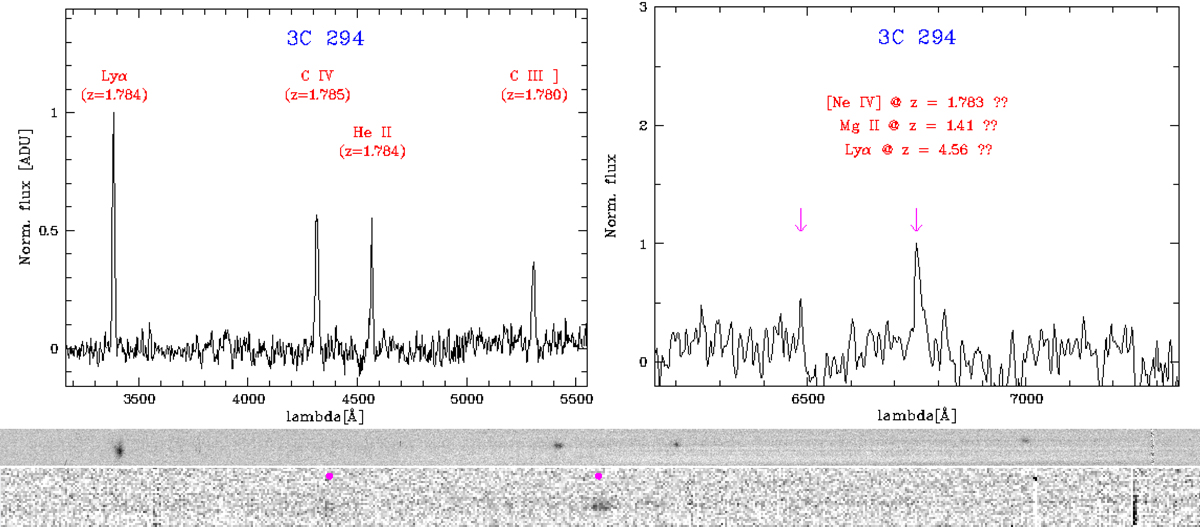
Top panel: our one-dimensional MODS spectra of the 3C 294 system in the blue (left) and (red) channel with the line identifications. The positions of the two emission features at λ6485 and λ6749.4 Å discussed in the text are indicated by arrows. Bottom panel: our two-dimensional MODS spectrum of the 3C 294 system in the blue channel (upper panel) showing the four emission lines as well as an excerpt of the two-dimensional spectrum in the red channel (lower panel) showing the emission line detected at λ6749.4 Å. The blue spectrum is shown across its full spectral range, the red spectrum with an identical width then the one-dimensional spectrum centered on the line at λ6749.4 Å. The two emission features are labeled by magenta dots.
Current usage metrics show cumulative count of Article Views (full-text article views including HTML views, PDF and ePub downloads, according to the available data) and Abstracts Views on Vision4Press platform.
Data correspond to usage on the plateform after 2015. The current usage metrics is available 48-96 hours after online publication and is updated daily on week days.
Initial download of the metrics may take a while.