Fig. 3.
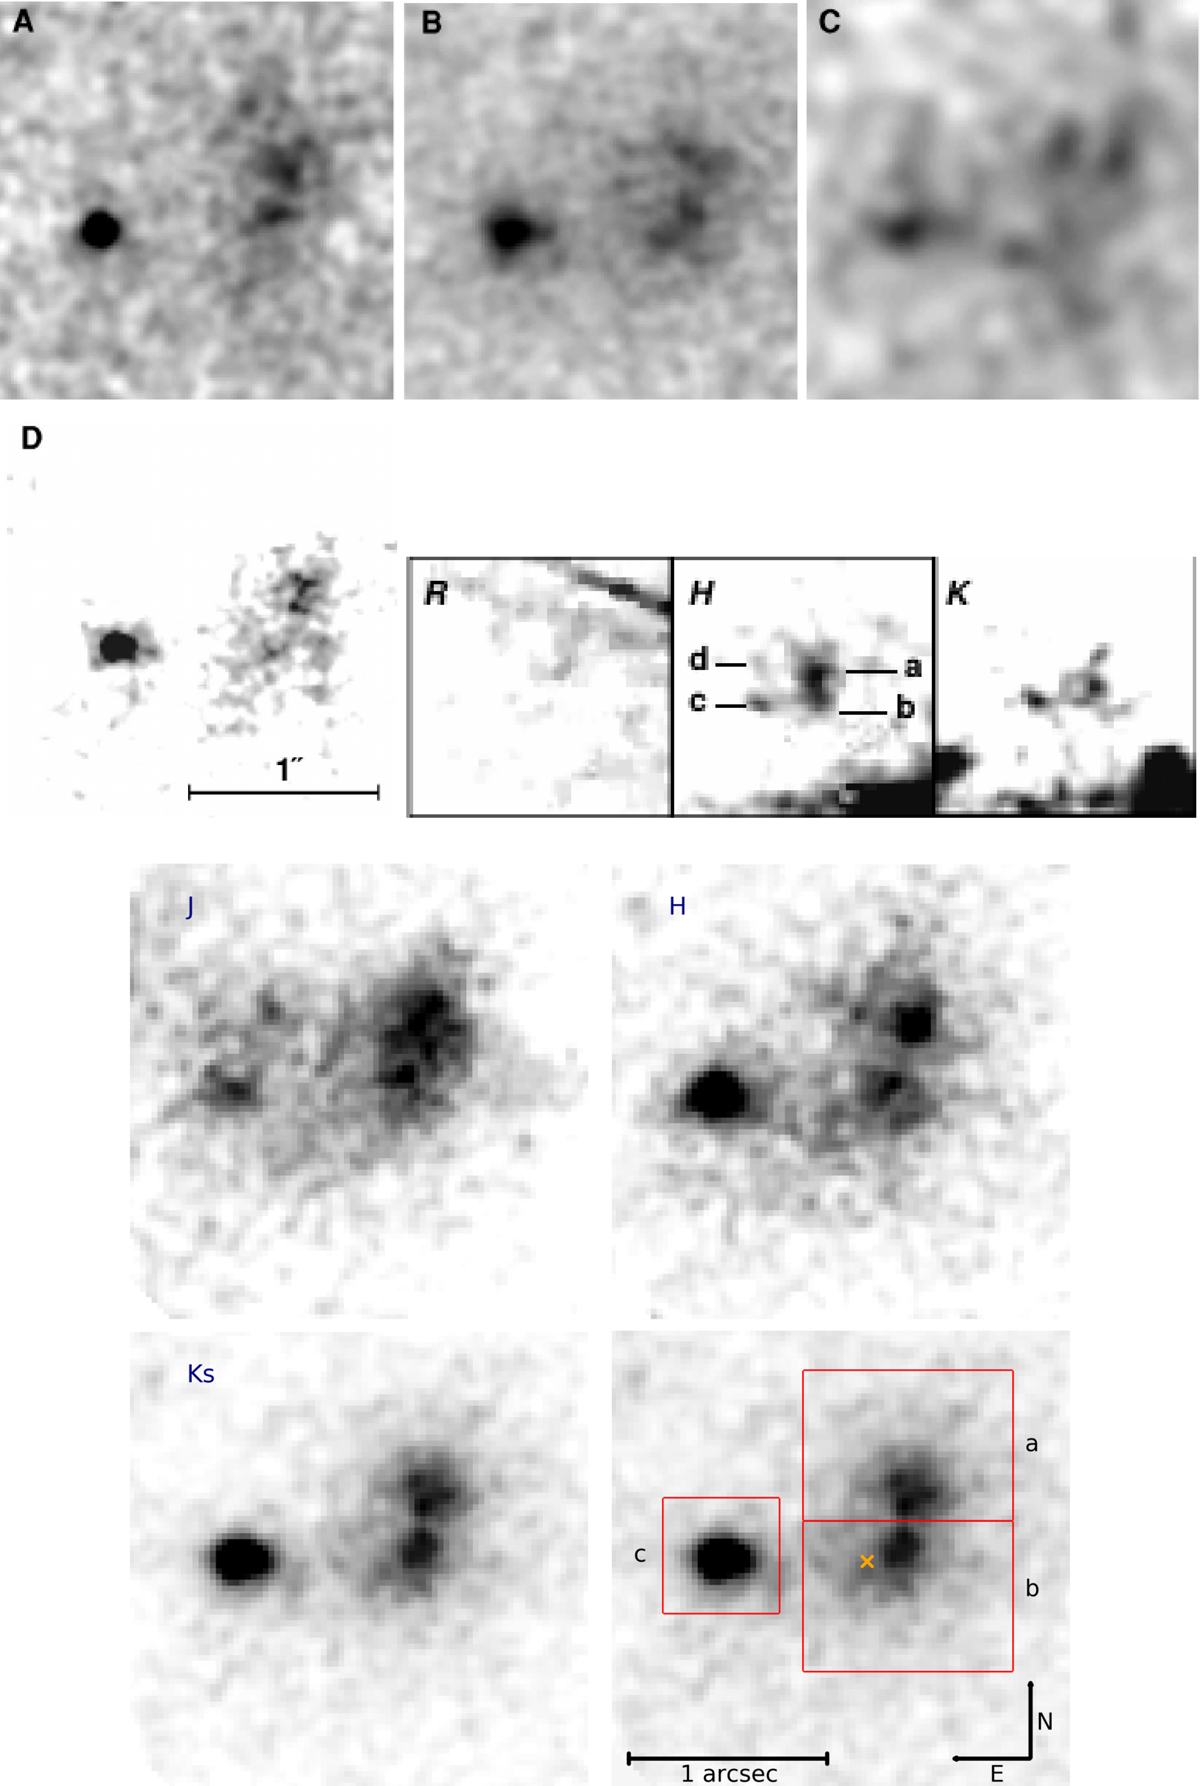
Two uppermost rows: AO NIR images of 3C 294 from earlier publications. Panel A: Keck II NIRSPEC K′ image from Stockton et al. (2004), Panel B: Subaru IRCS K′ image also from Stockton et al. (2004), Panel C: CFHT Hokupa K′ image from Stockton et al. (1999), and Panel D: Keck II SCam H-band image from Quirrenbach et al. (2001). The images A-D are adapted from Stockton et al. (2004). The three images right of image D show R (HST), H, and K CFHT PUEO data from Steinbring et al. (2002). Two lowest rows: our LBT FLAO and LUCI JHKs-images of 3C 294. The fourth image shows the scale, orientation, and apertures for the components used for the photometric analysis. They are 36 × 26 pixel (![]() ) for components a and b and 20 × 20 pixel (
) for components a and b and 20 × 20 pixel (![]() ) for component c. The labeling follows Steinbring et al. (2002). The cross marks the position of the radio core, its size reflects its positional error.
) for component c. The labeling follows Steinbring et al. (2002). The cross marks the position of the radio core, its size reflects its positional error.
Current usage metrics show cumulative count of Article Views (full-text article views including HTML views, PDF and ePub downloads, according to the available data) and Abstracts Views on Vision4Press platform.
Data correspond to usage on the plateform after 2015. The current usage metrics is available 48-96 hours after online publication and is updated daily on week days.
Initial download of the metrics may take a while.