Open Access
Fig. 2.
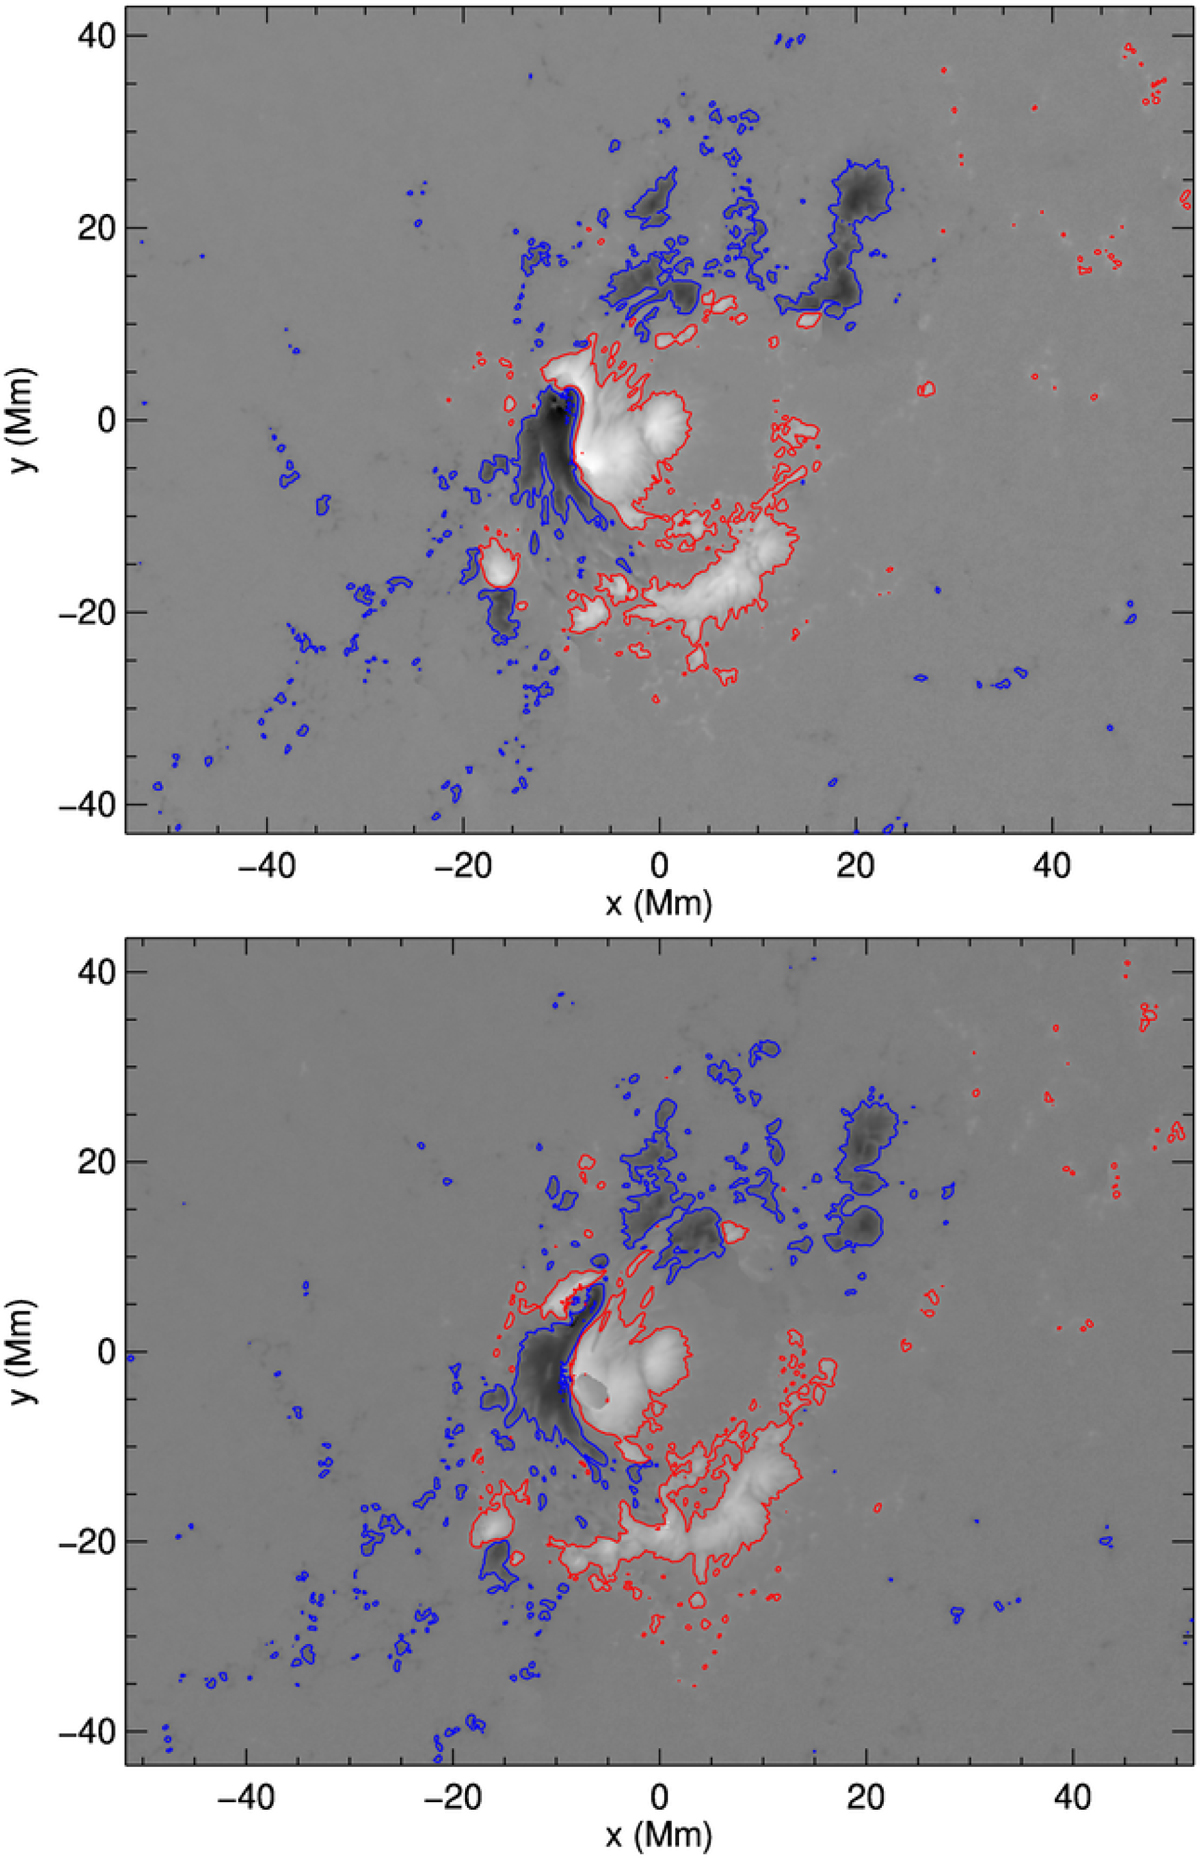
Photospheric distribution of Bz in AR 12673 at the beginning, top plot at 04:12 UT, and the end of our study interval, bottom plot at 13:36 UT. Blue contours correspond to Bz = −500 G, and red to Bz = 500 G.
Current usage metrics show cumulative count of Article Views (full-text article views including HTML views, PDF and ePub downloads, according to the available data) and Abstracts Views on Vision4Press platform.
Data correspond to usage on the plateform after 2015. The current usage metrics is available 48-96 hours after online publication and is updated daily on week days.
Initial download of the metrics may take a while.