Fig. 1.
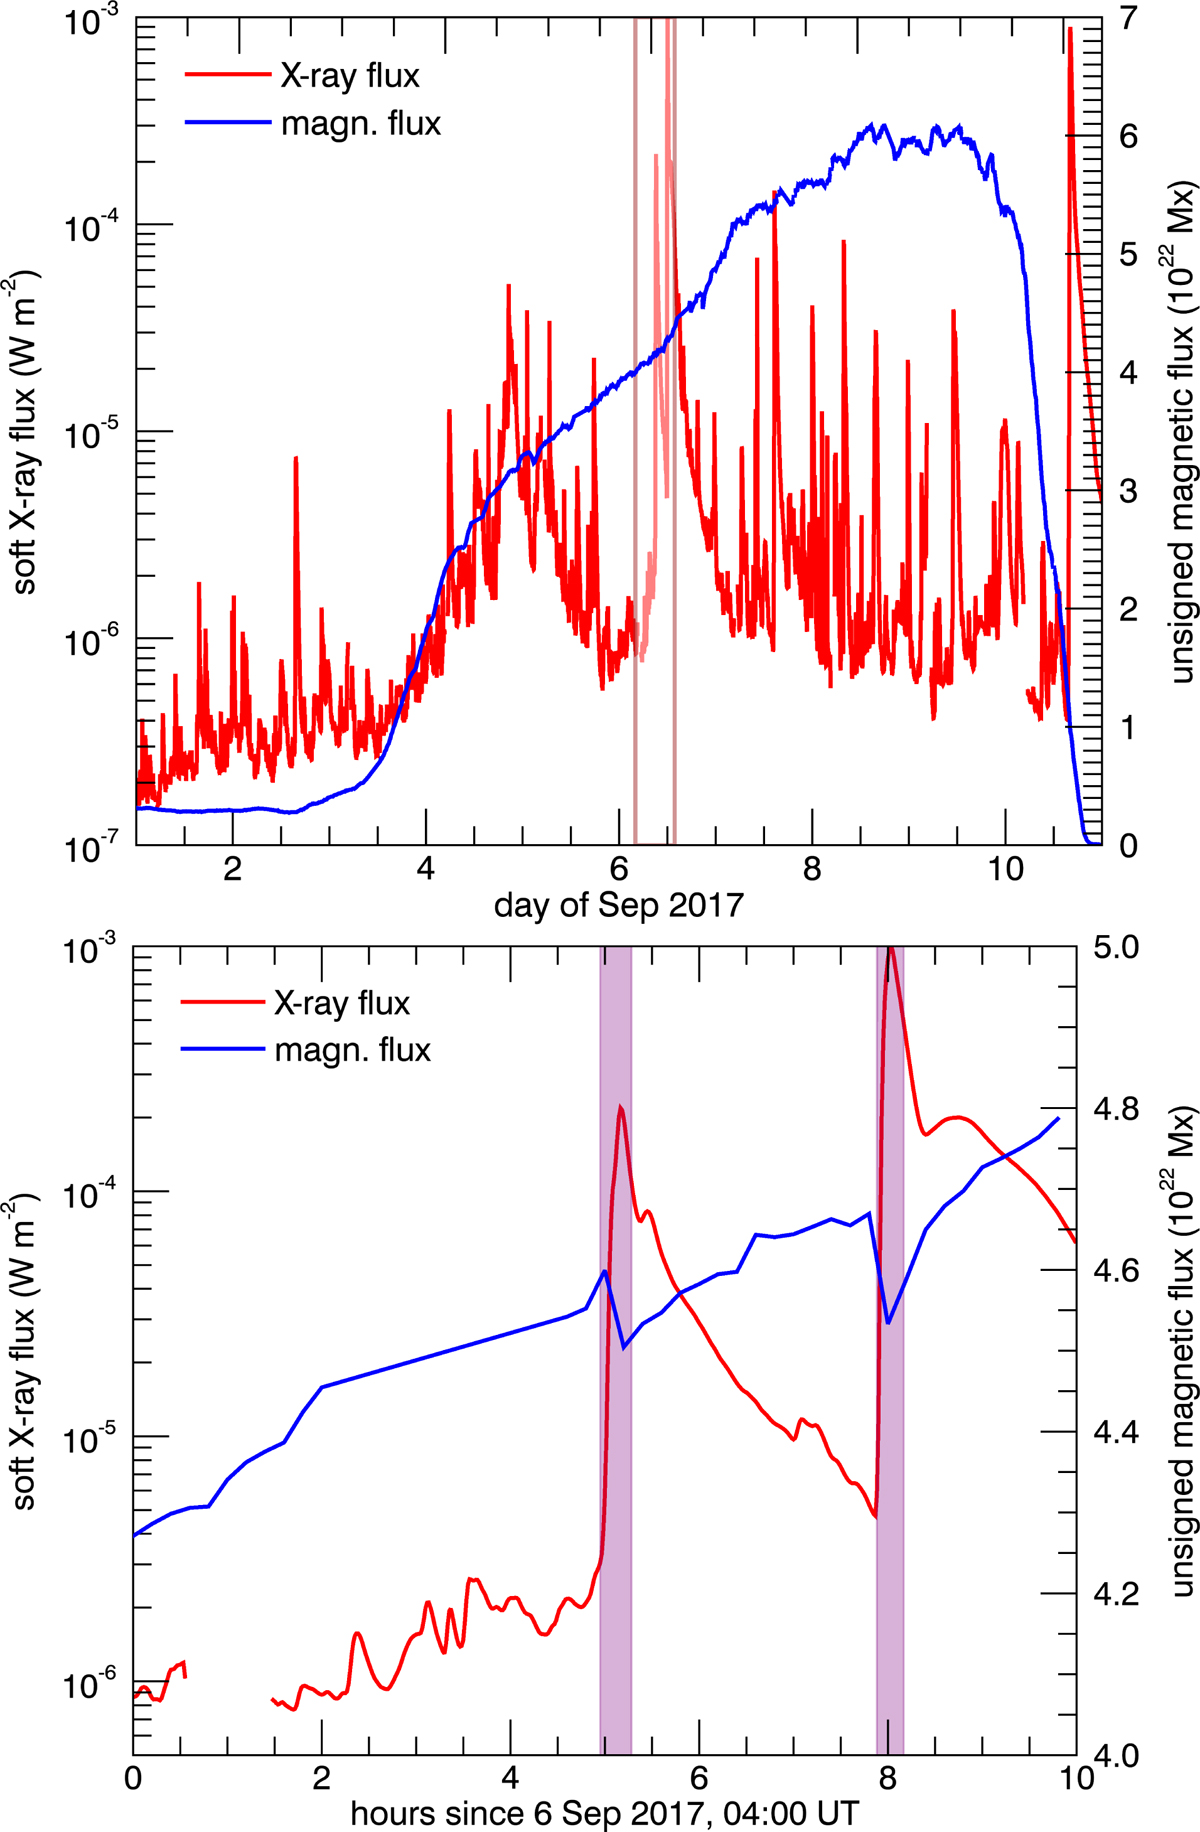
GOES soft X-ray light curve and evolution of HMI unsigned magnetic flux in AR 12673 for the first ten days of September 2017 (top). The brown vertical lines denote the interval of interest for this study, which is shown zoomed in at the bottom. The purple bands in this plot denote the time intervals of the X2.2 and the X9.3 flares, with onset times at 08:57 UT and 11:53 UT, respectively. The HMI magnetic flux in the bottom plot is of limited accuracy due to the emission of the flares, while between 06:00 UT and 08:36 UT there were no observations due to an eclipse of the Solar Dynamics Observatory (SDO) (Pesnell et al. 2012).
Current usage metrics show cumulative count of Article Views (full-text article views including HTML views, PDF and ePub downloads, according to the available data) and Abstracts Views on Vision4Press platform.
Data correspond to usage on the plateform after 2015. The current usage metrics is available 48-96 hours after online publication and is updated daily on week days.
Initial download of the metrics may take a while.