Open Access
Fig. 6.
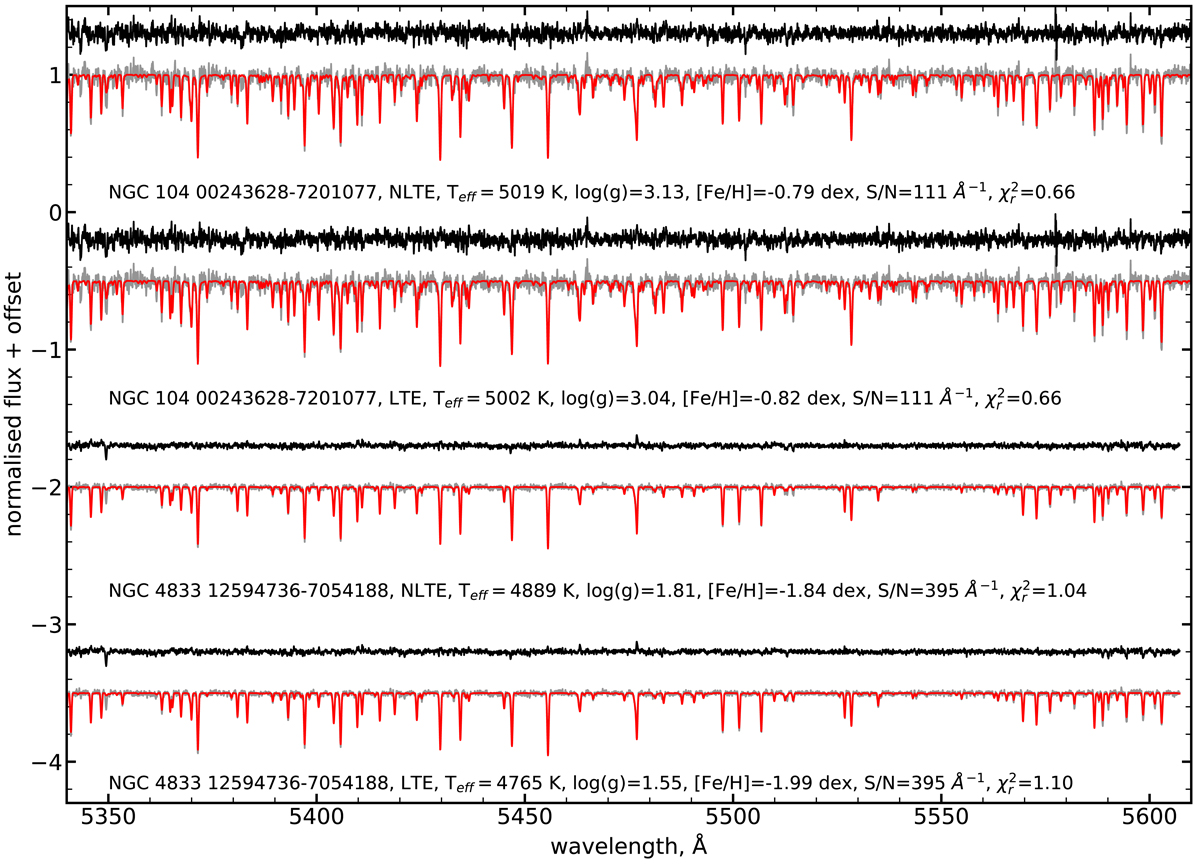
NLTE and LTE spectral fits for two stars from our cluster sample. The best-fit spectra are shown as red lines. The observed spectra are depicted with grey lines, while the fit residuals are shown with black lines. See inset for the derived Teff, log(g), [Fe/H], reduced χ2, and the S/N of the observed spectrum.
Current usage metrics show cumulative count of Article Views (full-text article views including HTML views, PDF and ePub downloads, according to the available data) and Abstracts Views on Vision4Press platform.
Data correspond to usage on the plateform after 2015. The current usage metrics is available 48-96 hours after online publication and is updated daily on week days.
Initial download of the metrics may take a while.