Fig. 9.
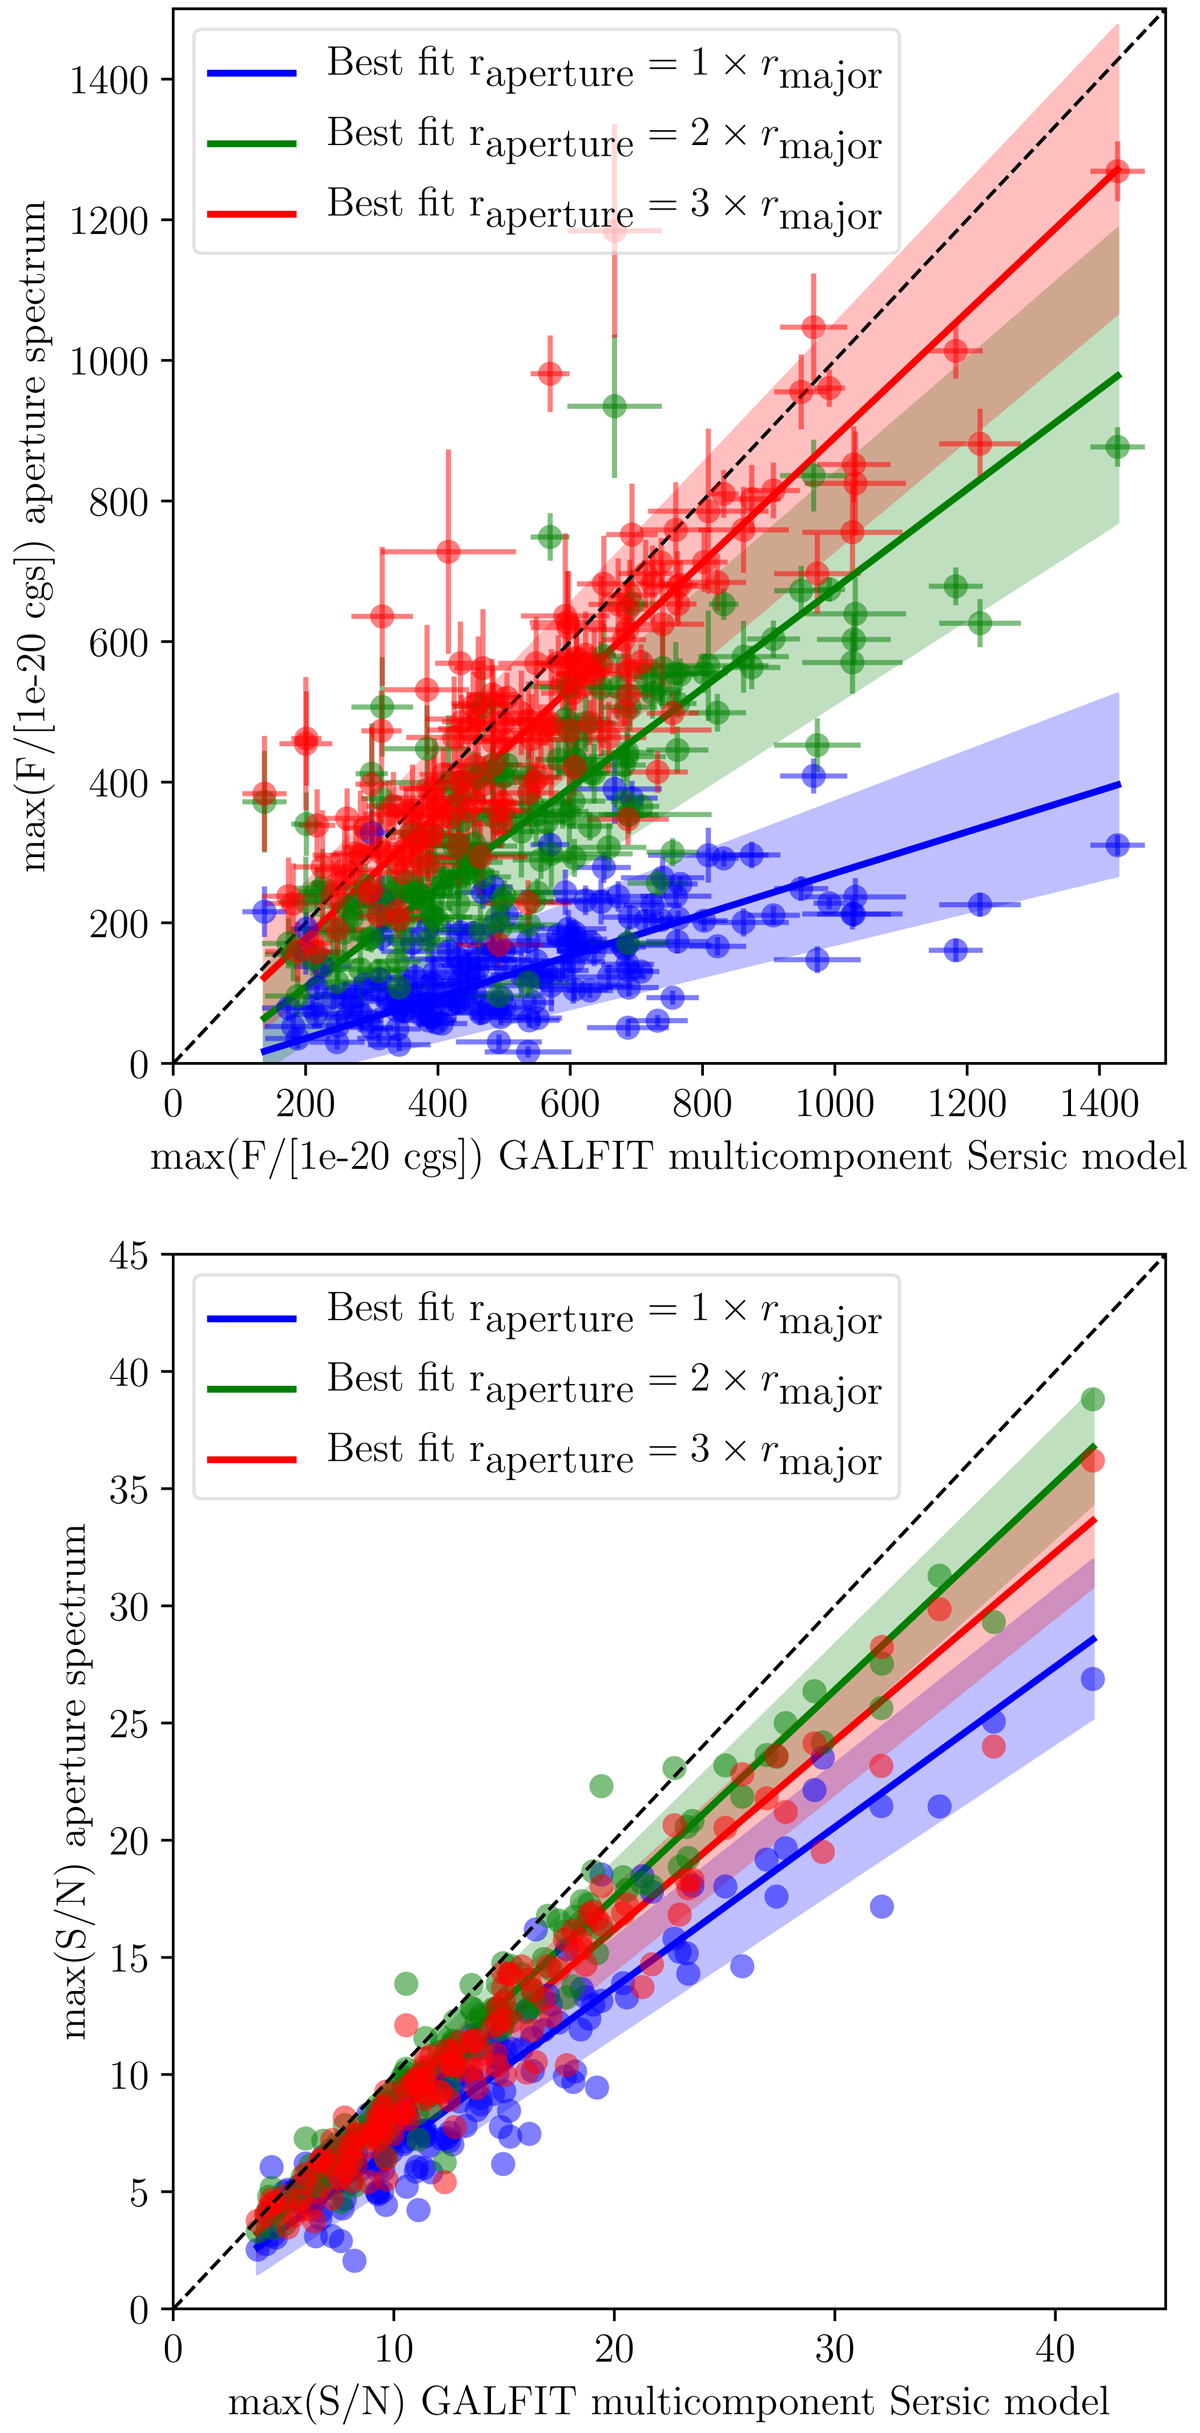
Comparison of the peak [OII] flux (top panel) and S/N (bottom panel) from the spectra of the 153 MUSE-Wide DR1 [OII] emitters also analyzed in Fig. 5. The spectra were extracted with TDOSE based on multi-component Sérsic models of the HST F814W reference imaging generated with GALFIT (x-axes), and apertures with radii equal to 1, 2, and 3 times the major axis of each object provided in the photometric catalogs by Skelton et al. (2014) plotted in blue, green and red, respectively. In both panels the dashed line shows the one-to-one relation, and the solid lines indicate the best linear fits to the individual flux and S/N measurements with the 3σ uncertainty on each fit indicated by the shaded regions. In all cases the average flux and S/N is higher for the model-based TDOSE extractions, even though the median flux increase is only ∼10% for the largest flux aperture.
Current usage metrics show cumulative count of Article Views (full-text article views including HTML views, PDF and ePub downloads, according to the available data) and Abstracts Views on Vision4Press platform.
Data correspond to usage on the plateform after 2015. The current usage metrics is available 48-96 hours after online publication and is updated daily on week days.
Initial download of the metrics may take a while.