Fig. 8.
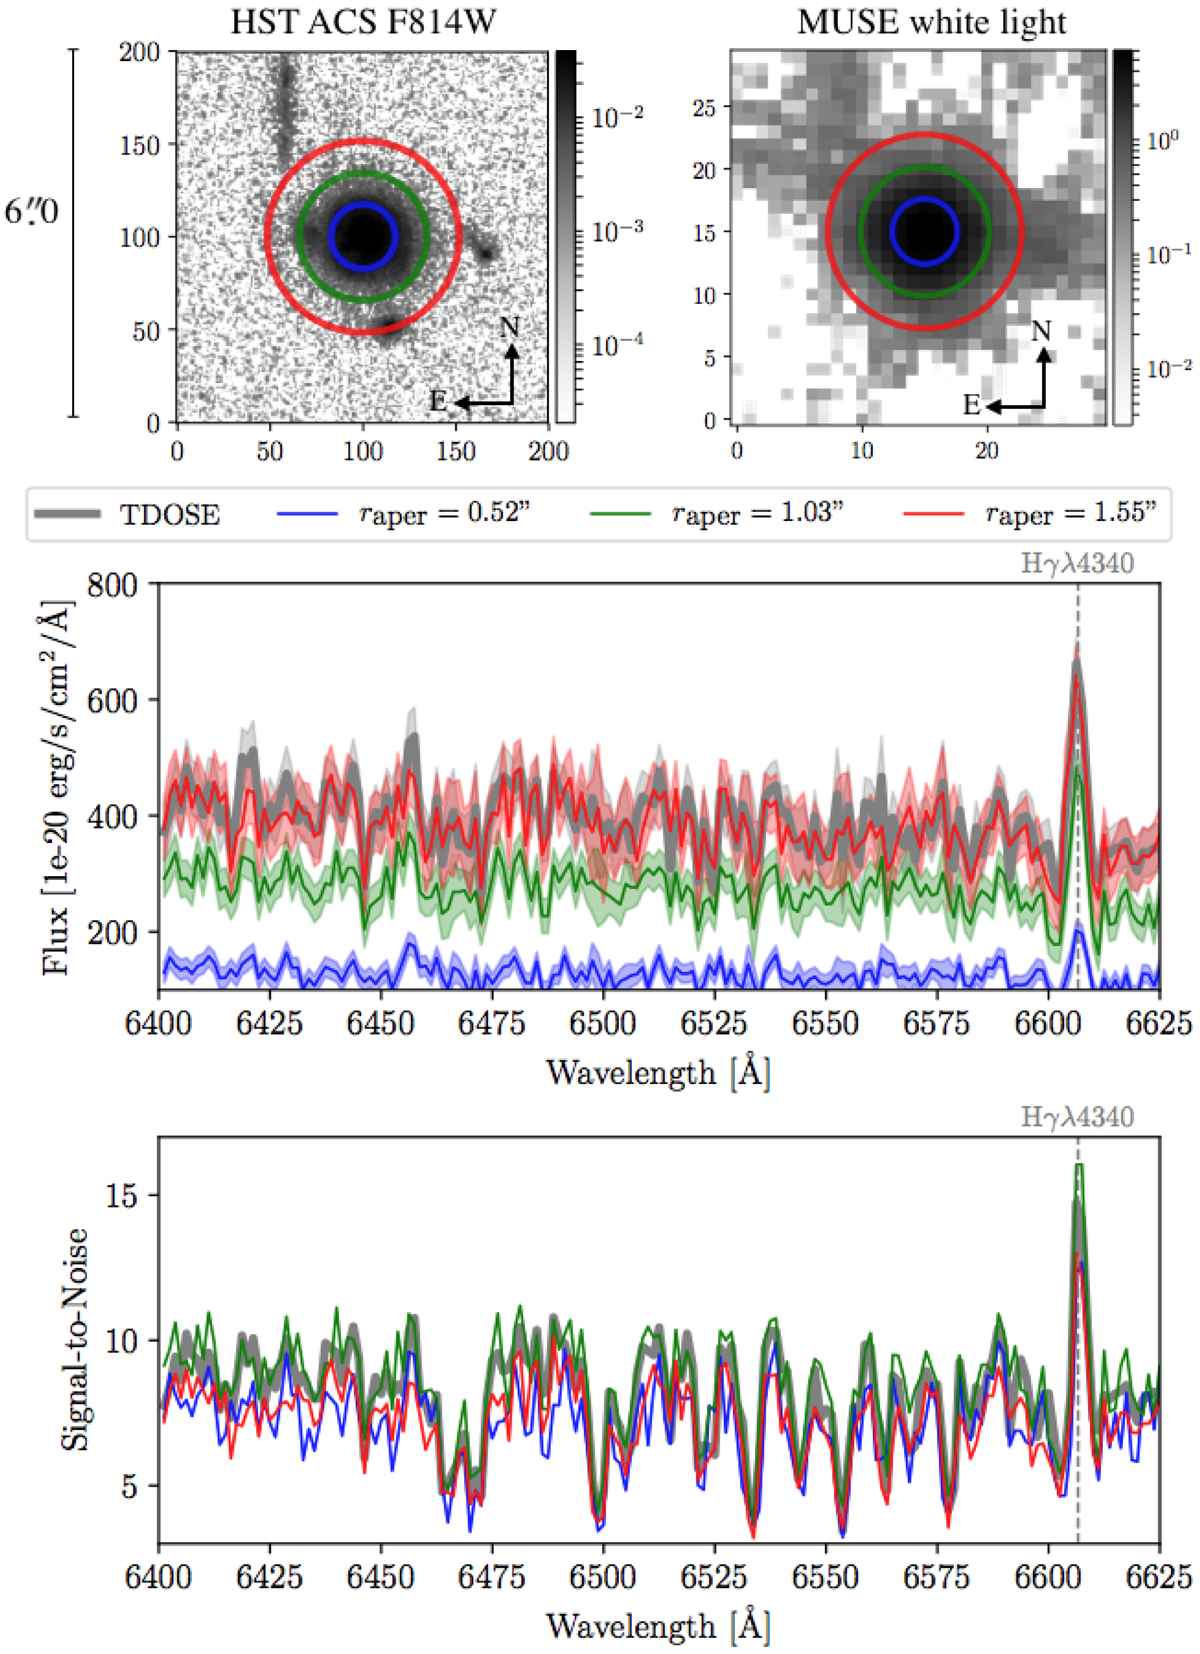
Comparison of three different aperture spectra (blue, green, and red) with the TDOSE spectrum of IDGuo = 9726 shown in Fig. 7 (thick gray) extracted based on a multi-component object model. The radii of the apertures are ![]() (blue),
(blue), ![]() (green), and
(green), and ![]() (red). Top panels:
(red). Top panels: ![]() postage stamps of the HST F814W and the MUSE white light images with the aperture sizes marked by the colored circles. Bottom panels: zoom-in on the emission line free continuum blueward of the Hγ line. The largest aperture (red) recovers the most flux, but suffers from a lower S/N. On the other hand, the median-aperture extraction (green) provides the highest S/N, but suffers from a lower recovered flux. The spectrum extracted with TDOSE (thick gray) recovers the same flux as the large-aperture spectrum, but also has a S/N similar to the median-aperture extraction. See Fig. 9 for similar effects for a sample of 153 fainter [OII] emitters.
postage stamps of the HST F814W and the MUSE white light images with the aperture sizes marked by the colored circles. Bottom panels: zoom-in on the emission line free continuum blueward of the Hγ line. The largest aperture (red) recovers the most flux, but suffers from a lower S/N. On the other hand, the median-aperture extraction (green) provides the highest S/N, but suffers from a lower recovered flux. The spectrum extracted with TDOSE (thick gray) recovers the same flux as the large-aperture spectrum, but also has a S/N similar to the median-aperture extraction. See Fig. 9 for similar effects for a sample of 153 fainter [OII] emitters.
Current usage metrics show cumulative count of Article Views (full-text article views including HTML views, PDF and ePub downloads, according to the available data) and Abstracts Views on Vision4Press platform.
Data correspond to usage on the plateform after 2015. The current usage metrics is available 48-96 hours after online publication and is updated daily on week days.
Initial download of the metrics may take a while.