Fig. 7.
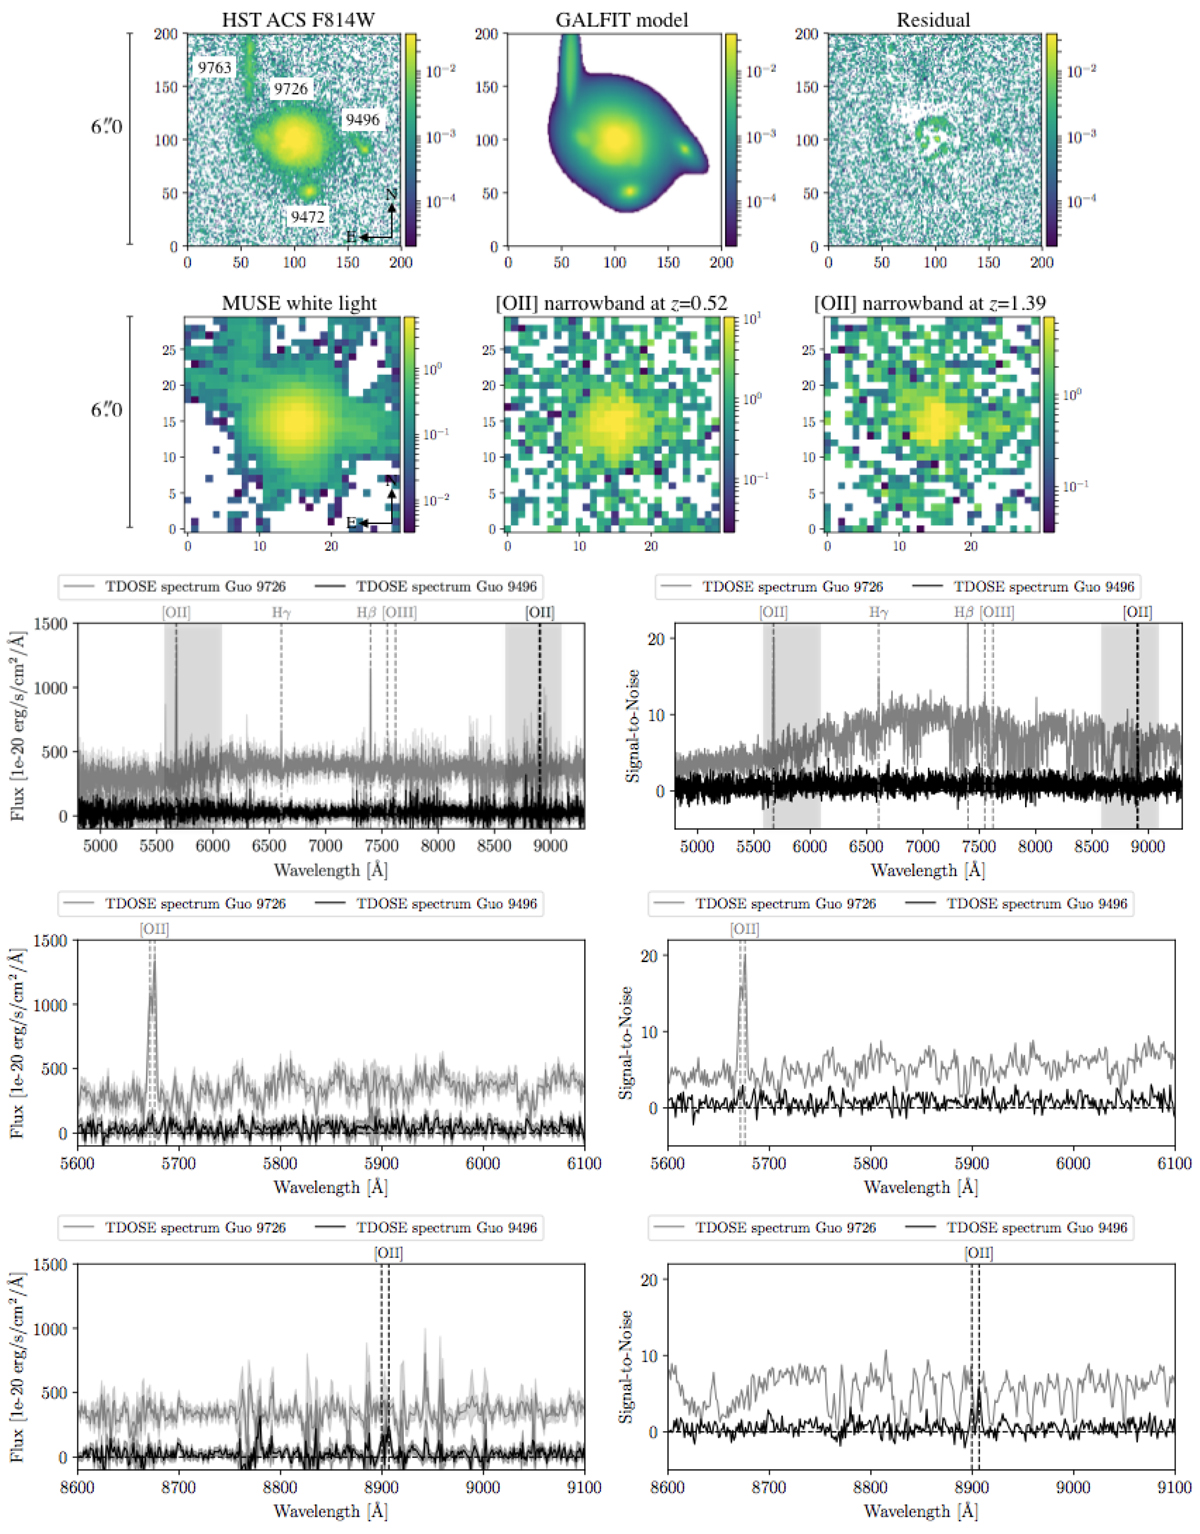
Illustration of extraction of multiple spectra while de-blending with TDOSE. Top panels (from top left to bottom right): ![]() postage stamps of the HST F814W image, the multi-component GALFIT model and residual, the MUSE white light image, and two narrowband images around [OII] of widths 1000 km s−1 in rest-frame positioned at redshifts 0.52 and 1.39, corresponding to the redshifts of object IDGuo = 9726 (IDMUSE-Wide = 125017033) and IDGuo = 9496 (IDMUSE-Wide = 125068147), respectively. Bottom panels: TDOSE spectra extracted for object IDGuo = 9726 (gray) and IDGuo = 9496 (black) based on the multi-component GALFIT model (top central panel). First two panels: full spectra and the position of prominent emission lines at the redshift of the two objects. The gray shaded regions show the location of the flux and S/N zoom-ins shown in the bottom two panels. Due to the efficient de-blending by TDOSE, the continuum and emission line contamination in the spectra is low, and reliable flux estimates can be obtained based on these extractions. Figure 8 shows a comparison between aperture spectra and the model-based TDOSE spectrum of IDGuo = 9726.
postage stamps of the HST F814W image, the multi-component GALFIT model and residual, the MUSE white light image, and two narrowband images around [OII] of widths 1000 km s−1 in rest-frame positioned at redshifts 0.52 and 1.39, corresponding to the redshifts of object IDGuo = 9726 (IDMUSE-Wide = 125017033) and IDGuo = 9496 (IDMUSE-Wide = 125068147), respectively. Bottom panels: TDOSE spectra extracted for object IDGuo = 9726 (gray) and IDGuo = 9496 (black) based on the multi-component GALFIT model (top central panel). First two panels: full spectra and the position of prominent emission lines at the redshift of the two objects. The gray shaded regions show the location of the flux and S/N zoom-ins shown in the bottom two panels. Due to the efficient de-blending by TDOSE, the continuum and emission line contamination in the spectra is low, and reliable flux estimates can be obtained based on these extractions. Figure 8 shows a comparison between aperture spectra and the model-based TDOSE spectrum of IDGuo = 9726.
Current usage metrics show cumulative count of Article Views (full-text article views including HTML views, PDF and ePub downloads, according to the available data) and Abstracts Views on Vision4Press platform.
Data correspond to usage on the plateform after 2015. The current usage metrics is available 48-96 hours after online publication and is updated daily on week days.
Initial download of the metrics may take a while.