Fig. 6.
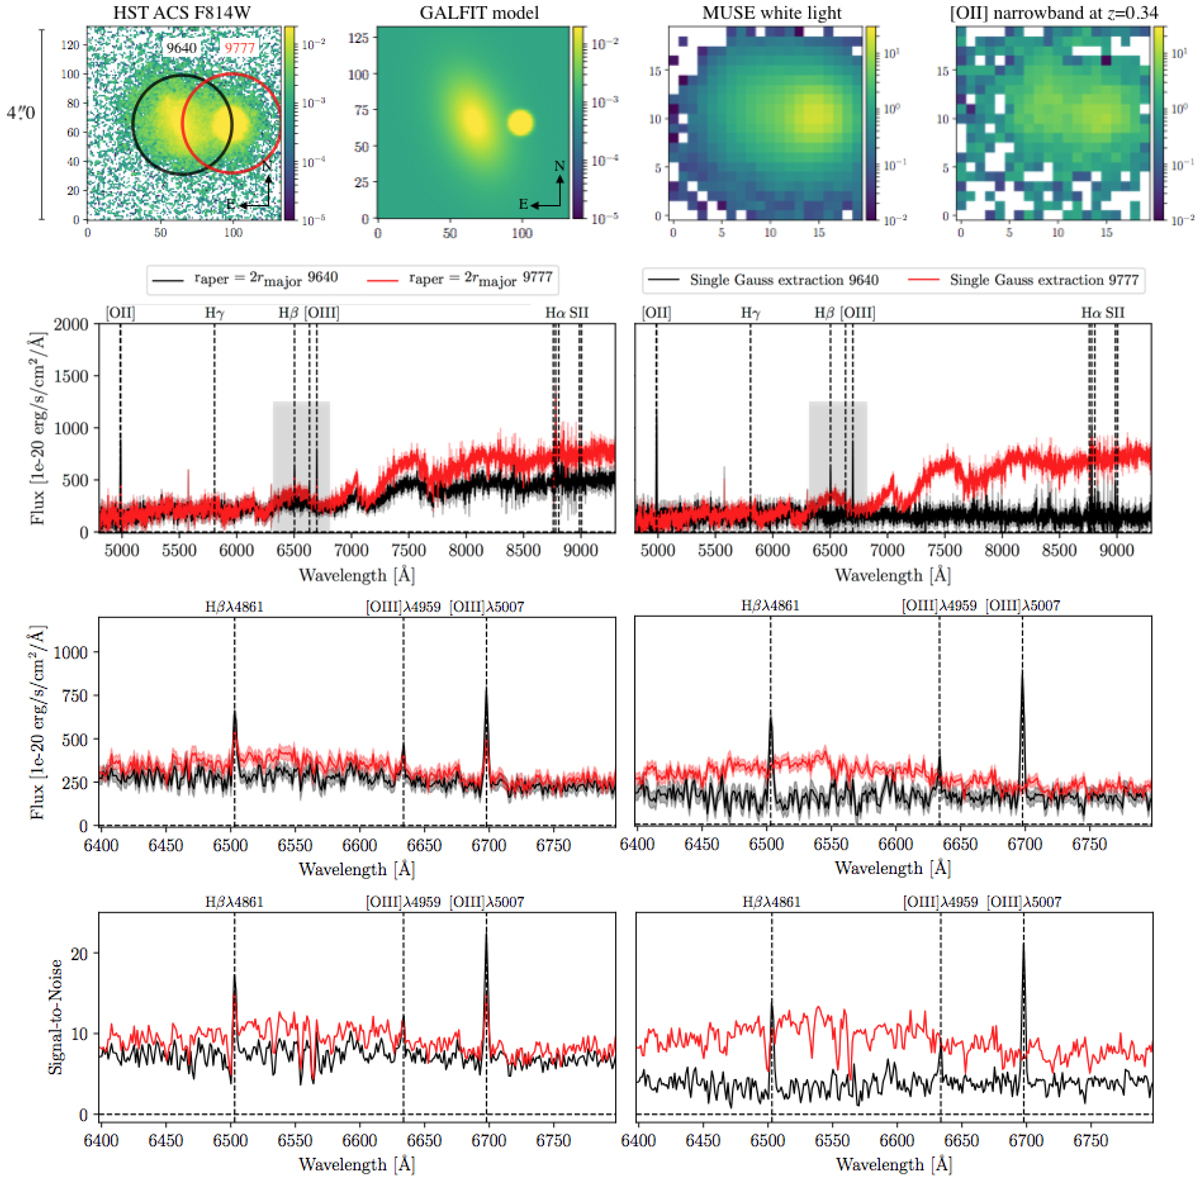
Illustration of extraction of galaxy (object IDGuo = 9640, IDMUSE-Wide = 102009072) and star (object IDGuo = 9777) spectrum while de-blending with TDOSE. Top panels: ![]() postage stamps of the HST F814W image, the two-component GALFIT model, the MUSE white light image, and a narrowband image around the [OII] emission of the galaxy at z = 0.34 from the MUSE data cube. Bottom left panels: aperture spectra extracted for the two objects, indicated by the circles in the top left panel. The aperture sizes were set to
postage stamps of the HST F814W image, the two-component GALFIT model, the MUSE white light image, and a narrowband image around the [OII] emission of the galaxy at z = 0.34 from the MUSE data cube. Bottom left panels: aperture spectra extracted for the two objects, indicated by the circles in the top left panel. The aperture sizes were set to ![]() of the galaxy IDGuo = 9640, providing a good compromise between flux and S/N (see Fig. 9). The three panels show the full spectrum and zoom-ins on the Hβ and [OIII]λ4959,5007 Å emission lines region (gray box in the top panel). Bottom right panels: identical to the bottom left panels, except that now the spectra shown were extracted with TDOSE based on the two-component GALFIT model (top second panel).
of the galaxy IDGuo = 9640, providing a good compromise between flux and S/N (see Fig. 9). The three panels show the full spectrum and zoom-ins on the Hβ and [OIII]λ4959,5007 Å emission lines region (gray box in the top panel). Bottom right panels: identical to the bottom left panels, except that now the spectra shown were extracted with TDOSE based on the two-component GALFIT model (top second panel).
Current usage metrics show cumulative count of Article Views (full-text article views including HTML views, PDF and ePub downloads, according to the available data) and Abstracts Views on Vision4Press platform.
Data correspond to usage on the plateform after 2015. The current usage metrics is available 48-96 hours after online publication and is updated daily on week days.
Initial download of the metrics may take a while.