Fig. 5.
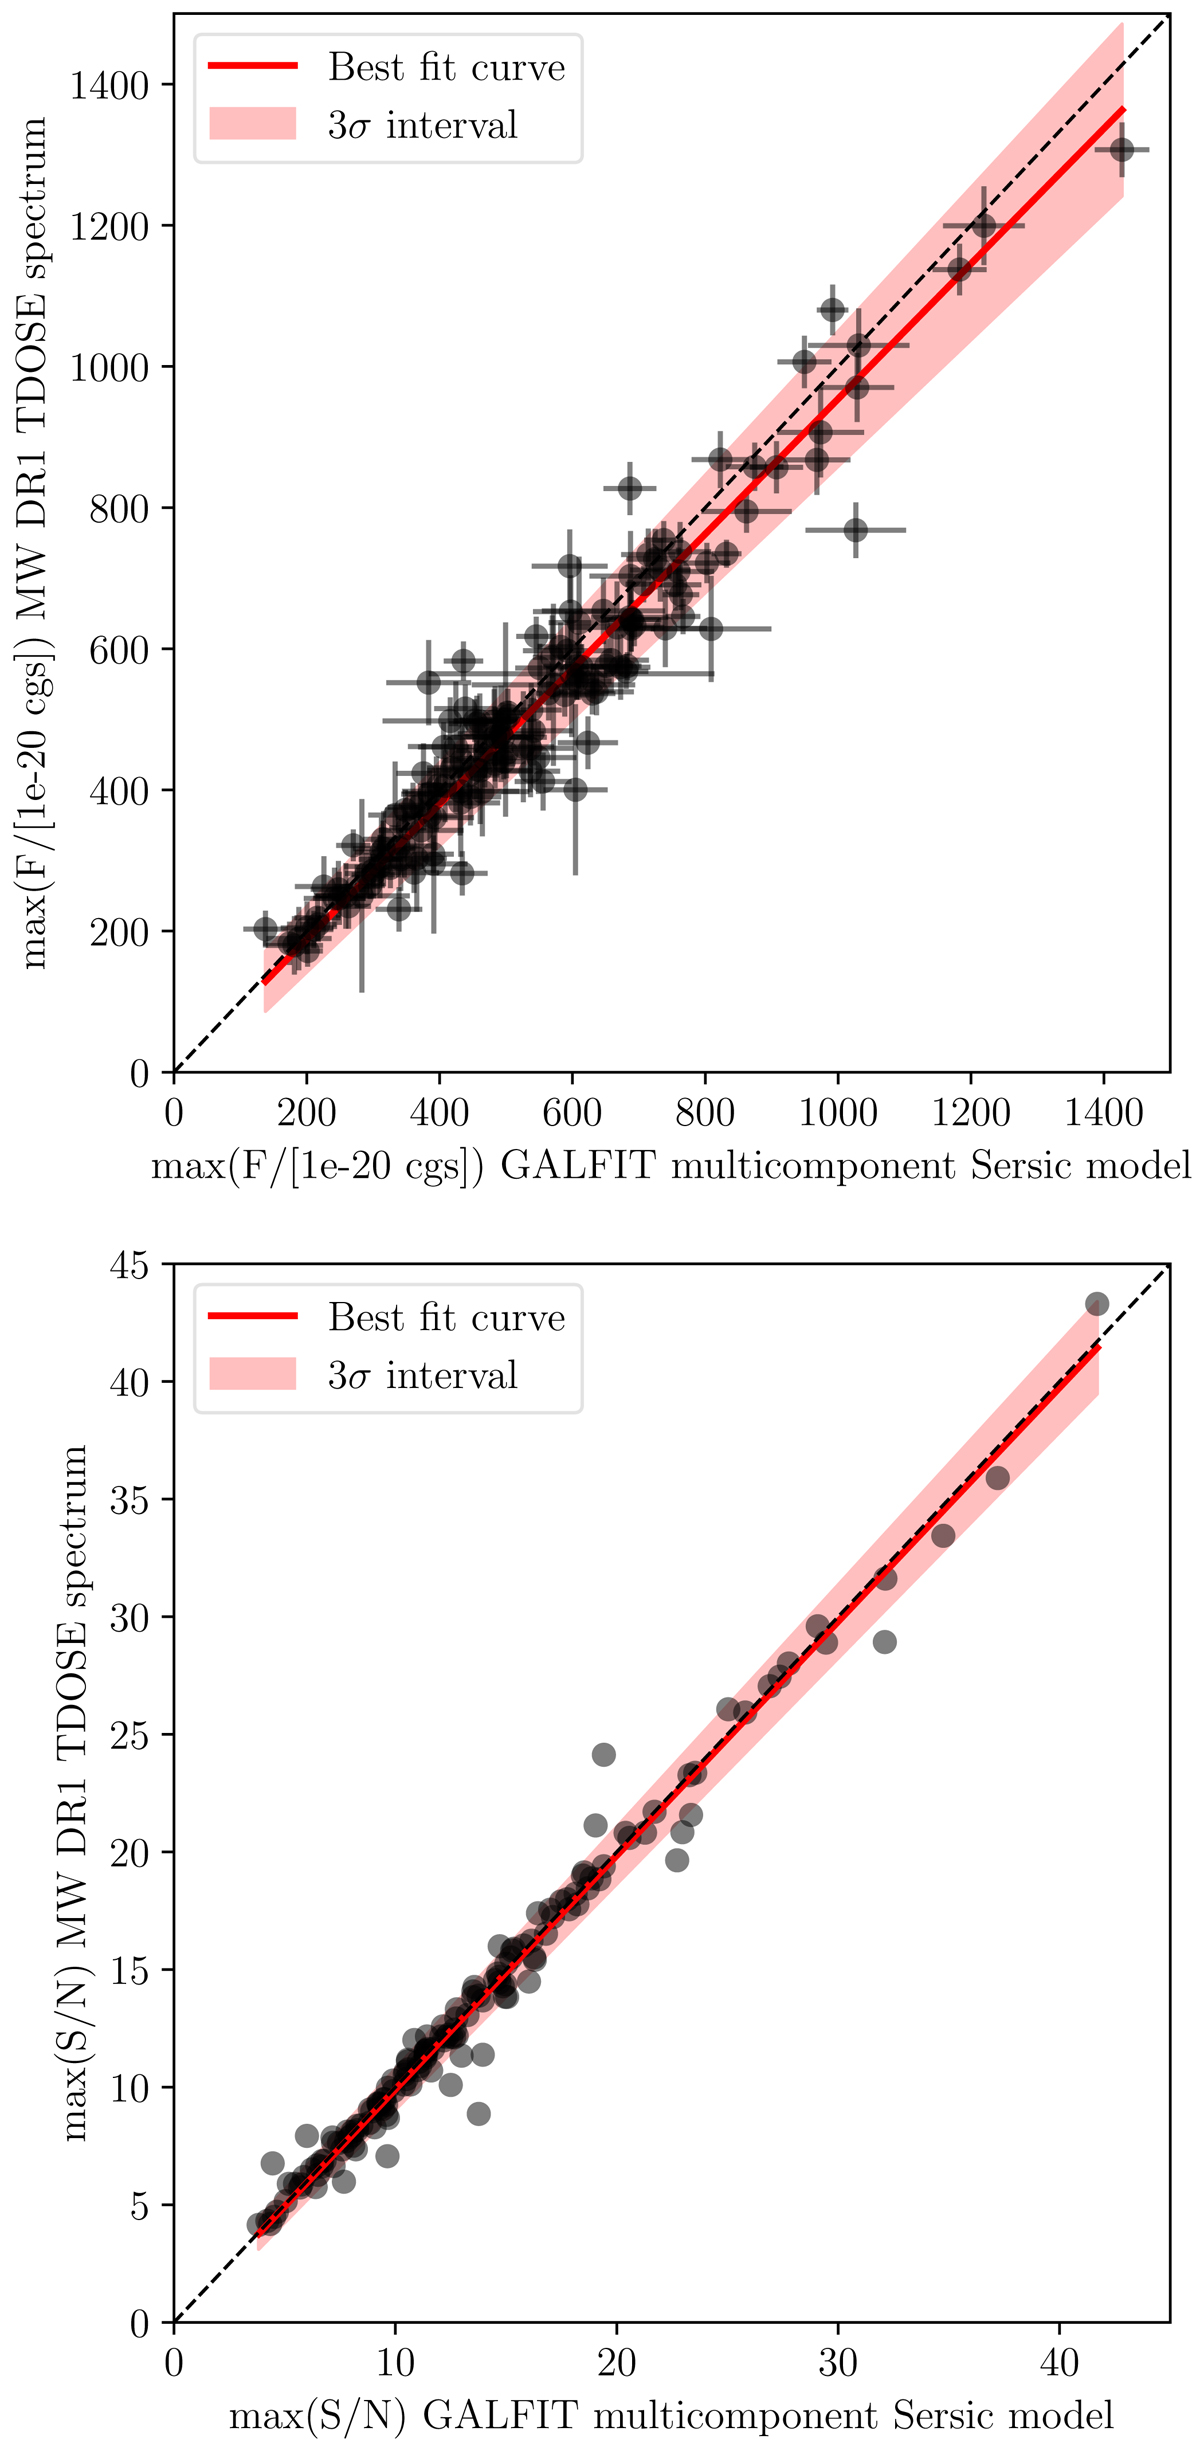
Comparison of the peak [OII] flux (top panel) and S/N (bottom panel) from the spectra of 153 MUSE-Wide DR1 [OII] emitters extracted with TDOSE based on multi-component Sérsic models of the HST F814W imaging generated with GALFIT (x-axes), and the MUSE-Wide DR1 TDOSE spectra based on single Gaussian models (y-axes). In both panels the dashed line indicates the one-to-one relation, and the red line is the best linear fit to the flux and S/N measurements with the 3σ uncertainty on the fit indicated by the shaded region.
Current usage metrics show cumulative count of Article Views (full-text article views including HTML views, PDF and ePub downloads, according to the available data) and Abstracts Views on Vision4Press platform.
Data correspond to usage on the plateform after 2015. The current usage metrics is available 48-96 hours after online publication and is updated daily on week days.
Initial download of the metrics may take a while.