Fig. 4.
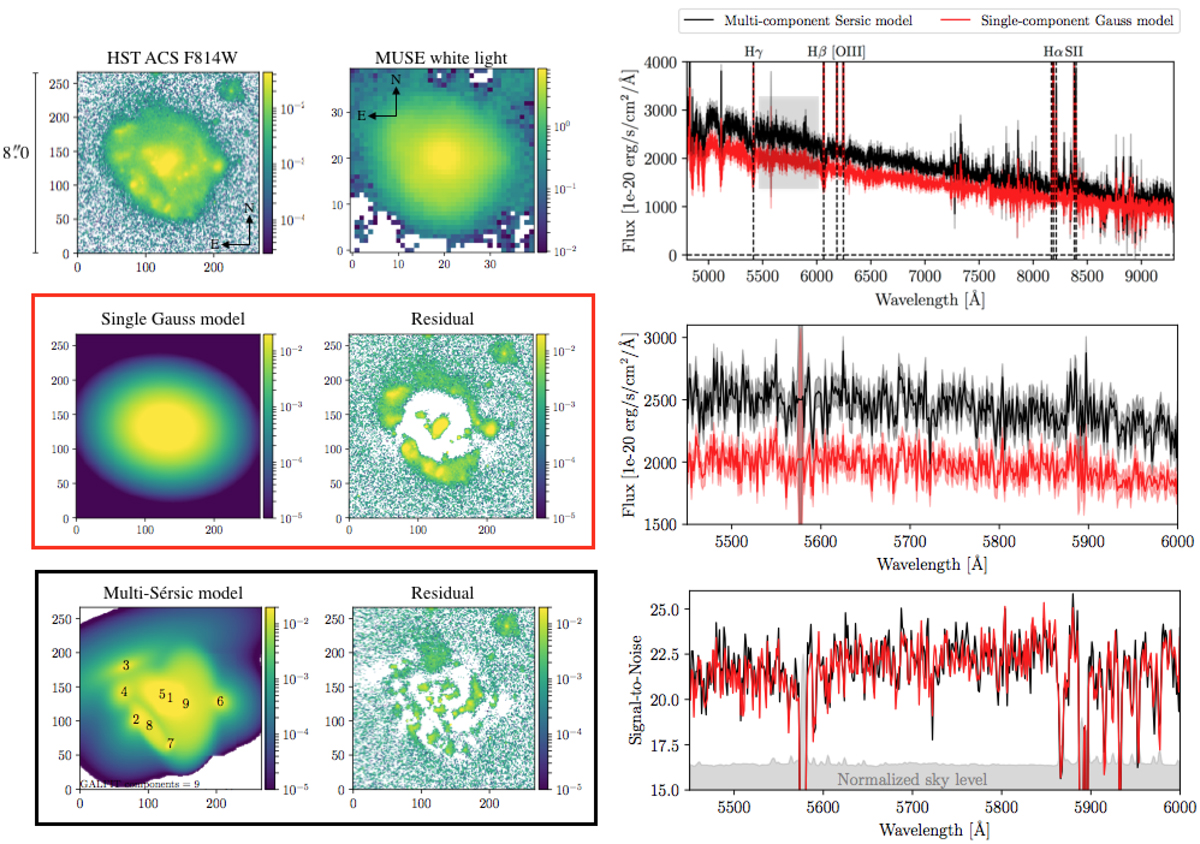
Spectral extractions performed with TDOSE for IDGuo = 10843 (IDMUSE-Wide = 112003032), a star forming Hαλ6563 Å emitter at z = 0.2475. Left panels: ![]() postage stamps of the HST F814W image, the collapsed MUSE white light image, a single-component Gaussian model and the corresponding HST residual (red box), and a multi-component Sérsic model generated with GALFIT and the corresponding HST residual (black box). The nine individual components of the GALFIT model are indicated by the black numbers in the bottom left panel. Righthand panels: TDOSE spectra extracted based on the single-component (red) and multi-component models (black) from the MUSE data cube. The black spectrum combines the flux from all nine sources marked in the bottom left panel. Top right panel: full spectrum, whereas bottom right panels: flux and S/N spectra of the continuum-only region between Hγ and Hβ marked by the gray square in the top right panel. Lower right panel: normalized sky flux level responsible for the S/N drops is indicated by the gray shaded region. The median flux increase of ∼20% when using a multi-component model shows the power of basing spectral extractions on multi-component models when the object’s light distribution is inhomogeneous.
postage stamps of the HST F814W image, the collapsed MUSE white light image, a single-component Gaussian model and the corresponding HST residual (red box), and a multi-component Sérsic model generated with GALFIT and the corresponding HST residual (black box). The nine individual components of the GALFIT model are indicated by the black numbers in the bottom left panel. Righthand panels: TDOSE spectra extracted based on the single-component (red) and multi-component models (black) from the MUSE data cube. The black spectrum combines the flux from all nine sources marked in the bottom left panel. Top right panel: full spectrum, whereas bottom right panels: flux and S/N spectra of the continuum-only region between Hγ and Hβ marked by the gray square in the top right panel. Lower right panel: normalized sky flux level responsible for the S/N drops is indicated by the gray shaded region. The median flux increase of ∼20% when using a multi-component model shows the power of basing spectral extractions on multi-component models when the object’s light distribution is inhomogeneous.
Current usage metrics show cumulative count of Article Views (full-text article views including HTML views, PDF and ePub downloads, according to the available data) and Abstracts Views on Vision4Press platform.
Data correspond to usage on the plateform after 2015. The current usage metrics is available 48-96 hours after online publication and is updated daily on week days.
Initial download of the metrics may take a while.