Fig. 3.
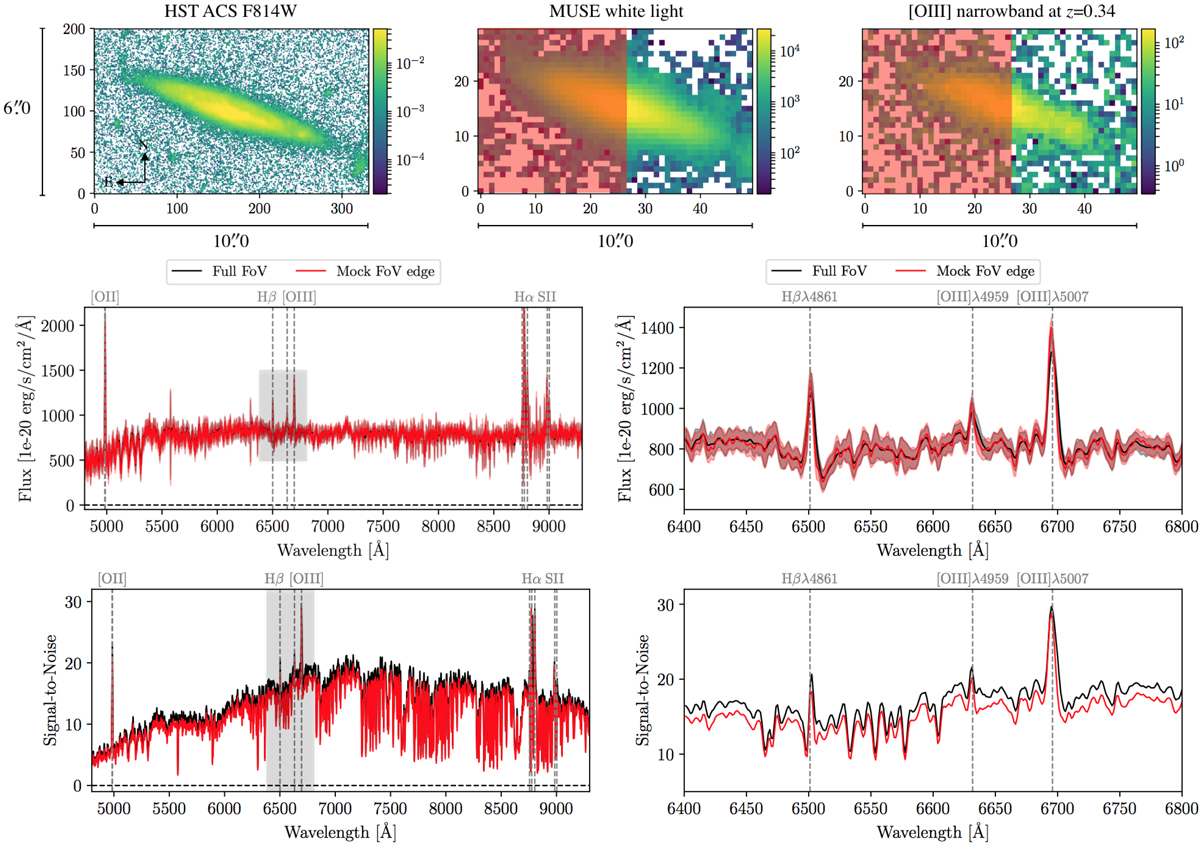
Illustration of the recovery of a spectrum from an object (IDGuo = 10701, IDMUSE-Wide = 125034103) only partially covered (red shaded region) in the IFS data cube. Top panels (from left to right): ![]() postage stamps of the HST F814W image, the MUSE white light image, and a narrowband image of width 1000 km s−1 (rest-frame) around [OIII]λ5007 Å. Bottom panels: flux (top) and S/N (bottom) spectra for the full MUSE wavelength range (left) and a zoom-in on the Hβ and [OIII]λ4959,5007 Å emission lines region (indicated by the gray box in the left panels). The black spectrum shows the results from a TDOSE extraction based on a single-source Gauss model of the full FoV shown in the top panels. The red spectrum on the other hand shows a TDOSE extraction using the same HST source model, but mimicking that the object falls off the edge of the MUSE detector, by only using the area of the MUSE data shaded in red for the model flux scaling in the TDOSE extraction.
postage stamps of the HST F814W image, the MUSE white light image, and a narrowband image of width 1000 km s−1 (rest-frame) around [OIII]λ5007 Å. Bottom panels: flux (top) and S/N (bottom) spectra for the full MUSE wavelength range (left) and a zoom-in on the Hβ and [OIII]λ4959,5007 Å emission lines region (indicated by the gray box in the left panels). The black spectrum shows the results from a TDOSE extraction based on a single-source Gauss model of the full FoV shown in the top panels. The red spectrum on the other hand shows a TDOSE extraction using the same HST source model, but mimicking that the object falls off the edge of the MUSE detector, by only using the area of the MUSE data shaded in red for the model flux scaling in the TDOSE extraction.
Current usage metrics show cumulative count of Article Views (full-text article views including HTML views, PDF and ePub downloads, according to the available data) and Abstracts Views on Vision4Press platform.
Data correspond to usage on the plateform after 2015. The current usage metrics is available 48-96 hours after online publication and is updated daily on week days.
Initial download of the metrics may take a while.