Fig. 11.
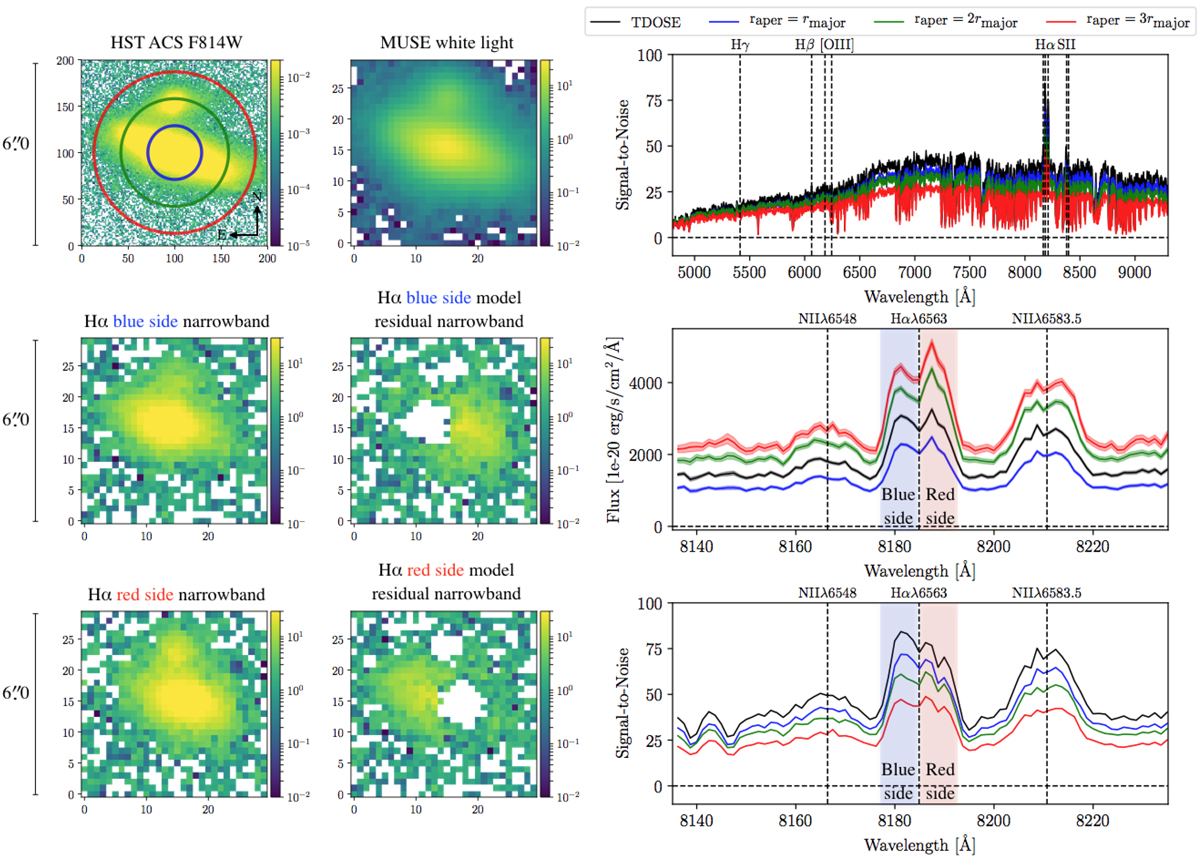
Example of spectral extraction of spectra from an object with significant wavelength dependent spatial flux variation due to rotation. These objects provide limitations to the capabilities of extractions with TDOSE based on reference image source models. Top left panels: ![]() postage stamp of the HST ACS F814W image and the MUSE white light image of IDGuo = 16009 (IDMUSE-Wide = 136002114). Below these, narrowband images of the blue and red sides of the Hα emission in the MUSE data cubes (left) and the residual cube after the removal of the scaled source model (right) are shown. Right panels: aperture spectra, corresponding to 1 (blue), 2 (green), and 3 (red) ×rmajor, together with the TDOSE spectrum based on a single-source Gaussian HST model (black). Bottom right panels: narrow zoom-in around the Hα+NII lines, with the ranges included in the narrowband images in the bottom left panels indicated by the shaded regions.
postage stamp of the HST ACS F814W image and the MUSE white light image of IDGuo = 16009 (IDMUSE-Wide = 136002114). Below these, narrowband images of the blue and red sides of the Hα emission in the MUSE data cubes (left) and the residual cube after the removal of the scaled source model (right) are shown. Right panels: aperture spectra, corresponding to 1 (blue), 2 (green), and 3 (red) ×rmajor, together with the TDOSE spectrum based on a single-source Gaussian HST model (black). Bottom right panels: narrow zoom-in around the Hα+NII lines, with the ranges included in the narrowband images in the bottom left panels indicated by the shaded regions.
Current usage metrics show cumulative count of Article Views (full-text article views including HTML views, PDF and ePub downloads, according to the available data) and Abstracts Views on Vision4Press platform.
Data correspond to usage on the plateform after 2015. The current usage metrics is available 48-96 hours after online publication and is updated daily on week days.
Initial download of the metrics may take a while.