Fig. 10.
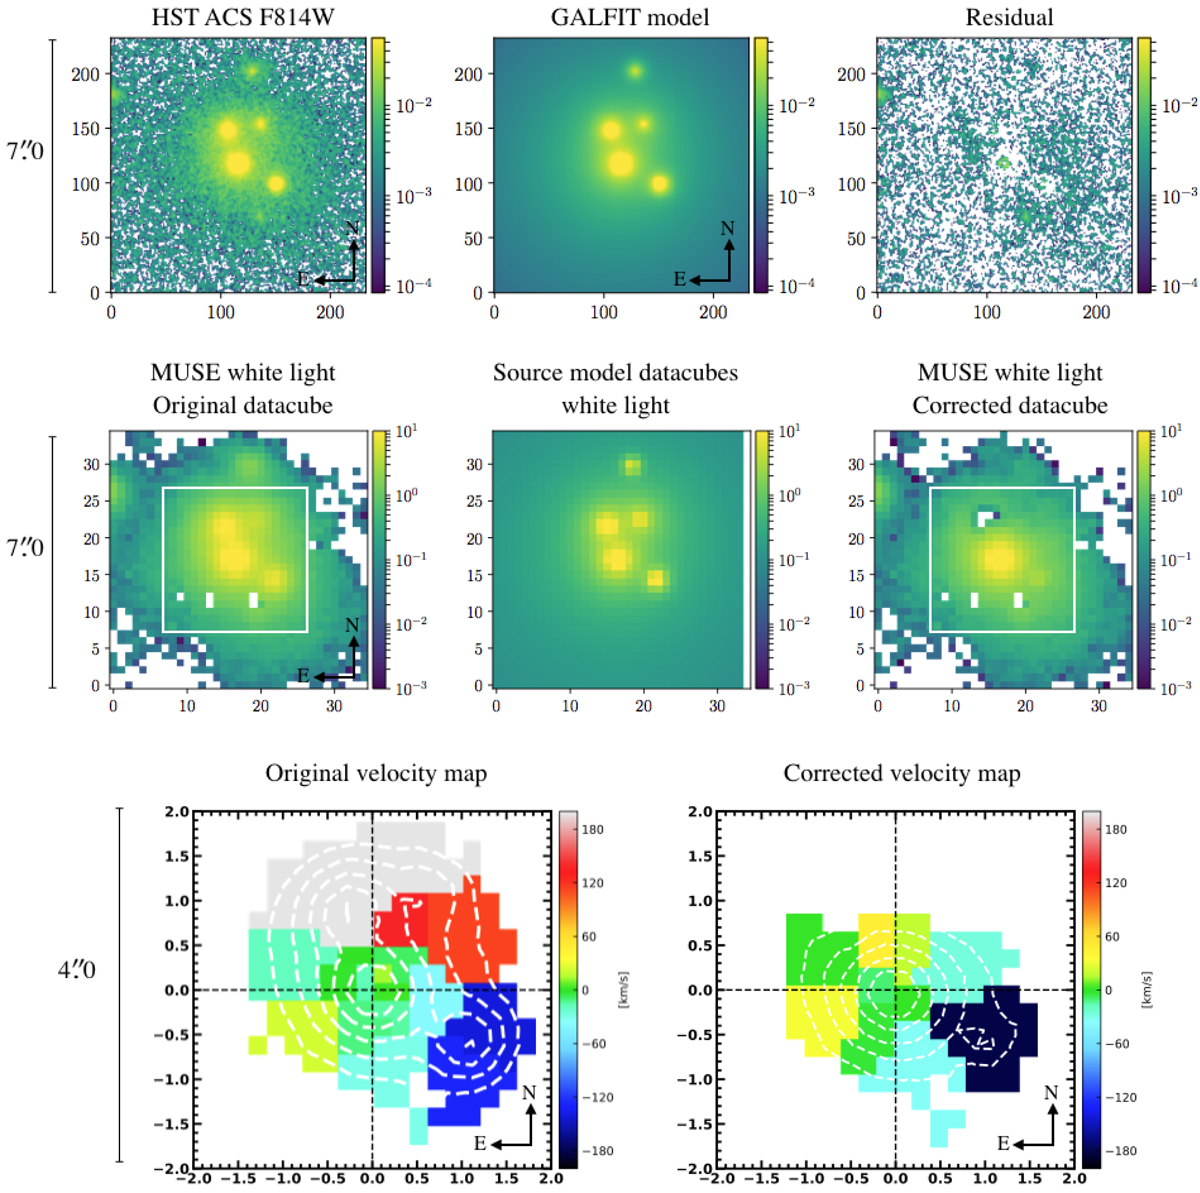
Illustration of the improved velocity map obtained after removing the 3D source models of the contaminants generated by TDOSE from the original IFS data cube. Top panels: ![]() postage stamp of the HST F814W image, the HST multi-component GALFIT model, and the corresponding residual image. Central panels:
postage stamp of the HST F814W image, the HST multi-component GALFIT model, and the corresponding residual image. Central panels: ![]() postage stamp of the MUSE white light image, the HST model in the MUSE coordinate system, and the MUSE white light image after removing all but the central 3D source model generated by TDOSE. Bottom left panel: velocity map generated from the intrinsic MUSE data cube (see Sect. 4.6 for details). Bottom right panel: velocity map constructed the same way, but now based on the MUSE cube after the contamination has been removed using the TDOSE source models and indicates that the central galaxy has no significant rotation. The extent of the velocity maps are marked by the white squares in the MUSE white light images. We note that the Voronoi bins in the two velocity maps, as well as their extent, are different as we are left with the flux belonging only to the galaxy of interest after the contaminating flux was removed (bottom right panel).
postage stamp of the MUSE white light image, the HST model in the MUSE coordinate system, and the MUSE white light image after removing all but the central 3D source model generated by TDOSE. Bottom left panel: velocity map generated from the intrinsic MUSE data cube (see Sect. 4.6 for details). Bottom right panel: velocity map constructed the same way, but now based on the MUSE cube after the contamination has been removed using the TDOSE source models and indicates that the central galaxy has no significant rotation. The extent of the velocity maps are marked by the white squares in the MUSE white light images. We note that the Voronoi bins in the two velocity maps, as well as their extent, are different as we are left with the flux belonging only to the galaxy of interest after the contaminating flux was removed (bottom right panel).
Current usage metrics show cumulative count of Article Views (full-text article views including HTML views, PDF and ePub downloads, according to the available data) and Abstracts Views on Vision4Press platform.
Data correspond to usage on the plateform after 2015. The current usage metrics is available 48-96 hours after online publication and is updated daily on week days.
Initial download of the metrics may take a while.