Fig. 8.
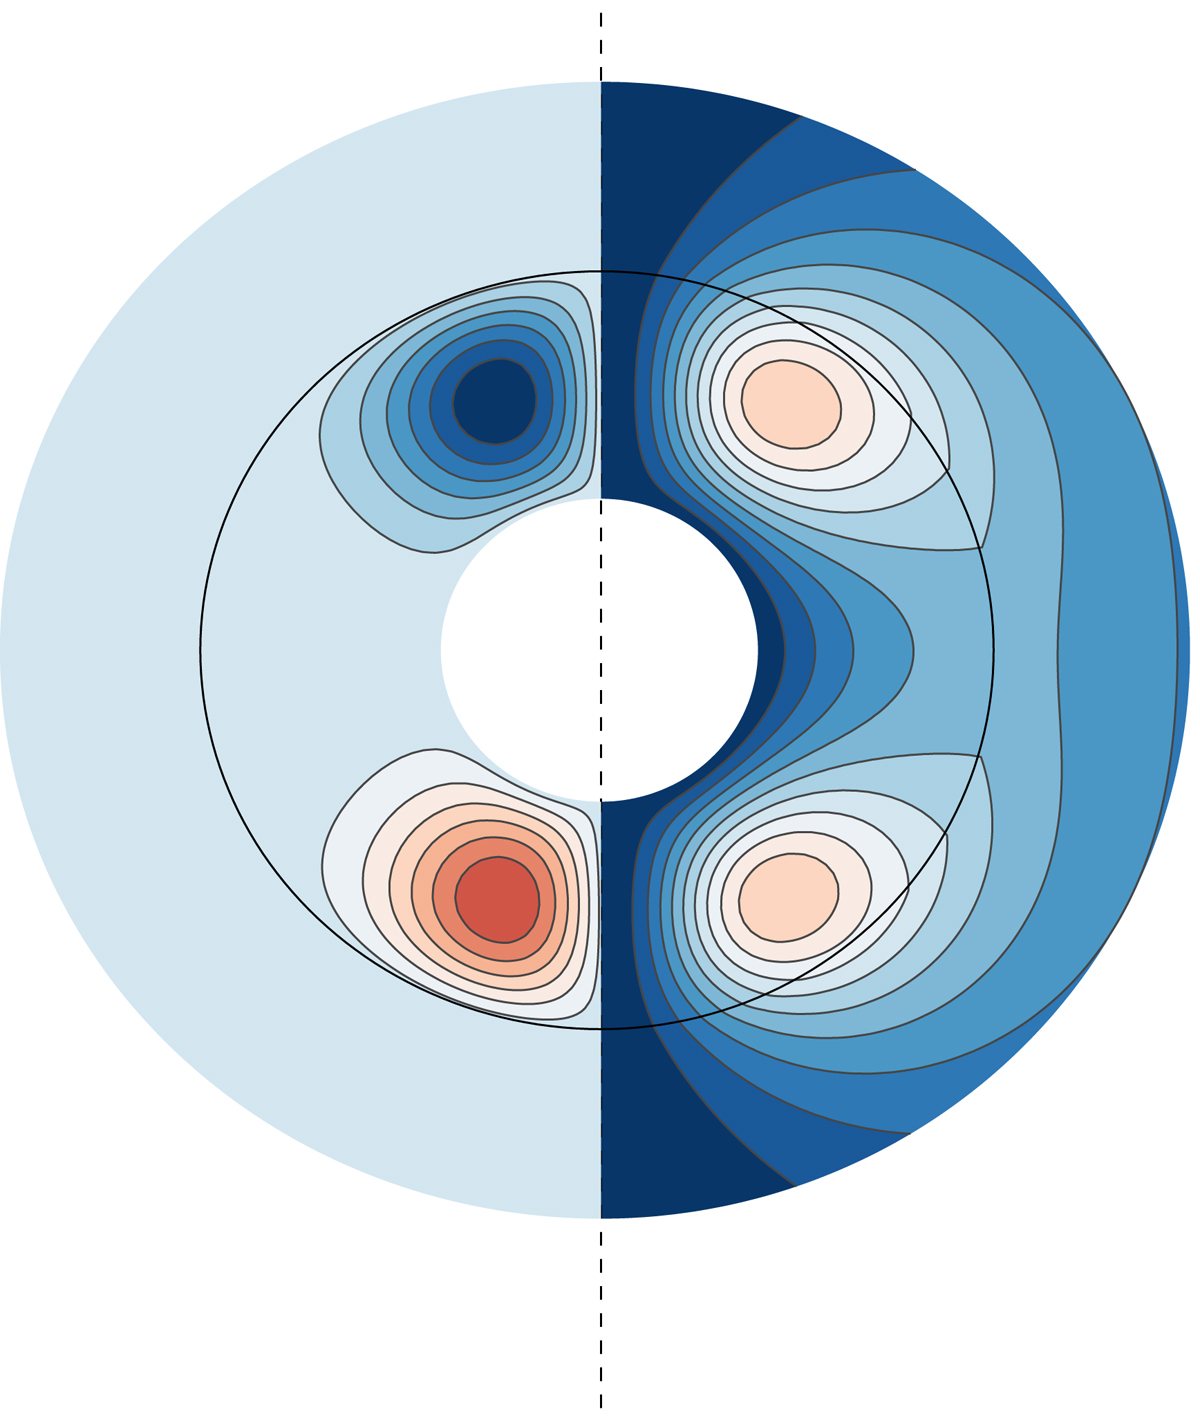
Field topology for CΩ = 50 (see text). The left hemisphere represents the isocontour lines of the toroidal field; blue levels show the negative and red levels the positive toroidal field. The right hemisphere represents the streamlines of the poloidal field. Blue levels show the counterclockwise and red levels the clockwise field lines. The black circle represents the stellar surface.
Current usage metrics show cumulative count of Article Views (full-text article views including HTML views, PDF and ePub downloads, according to the available data) and Abstracts Views on Vision4Press platform.
Data correspond to usage on the plateform after 2015. The current usage metrics is available 48-96 hours after online publication and is updated daily on week days.
Initial download of the metrics may take a while.