Fig. 3.
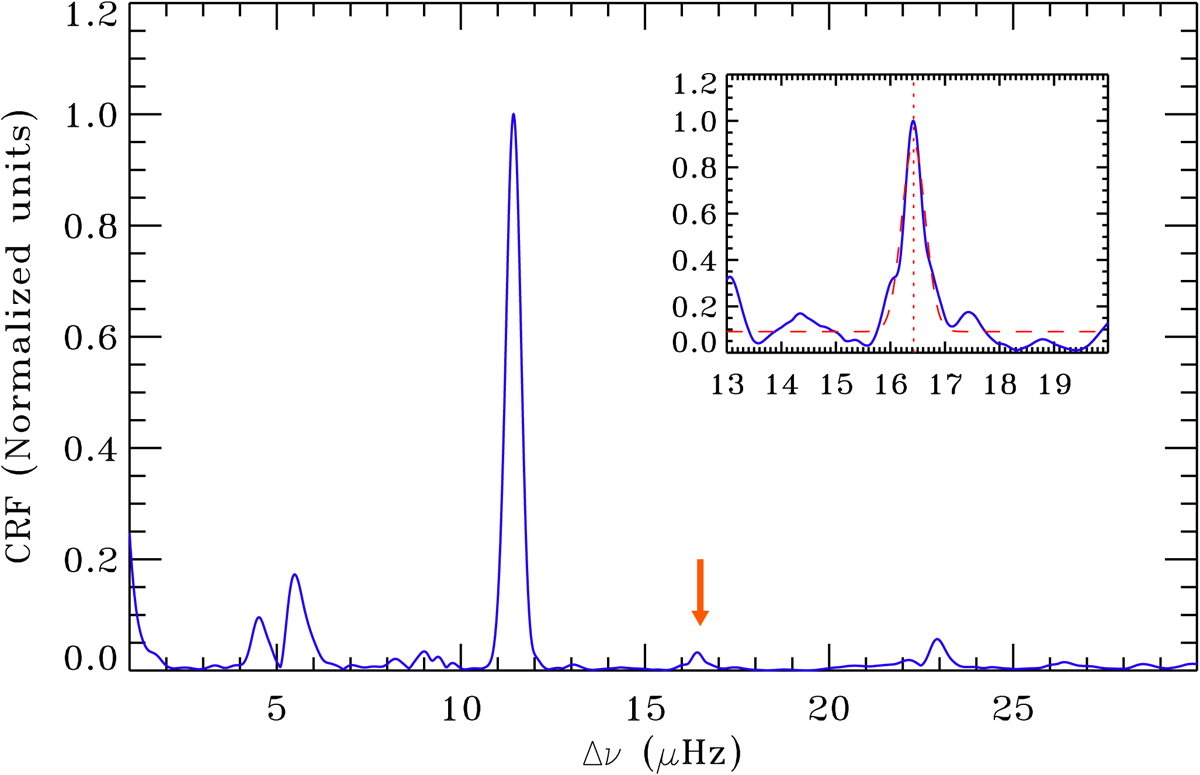
CRF of the region of the PSD of EK Eri centered around νmax (in blue) for a search range between 1 and 30 μHz, where multiples of the daily aliasing at 11.57 μHz are clearly visible. The arrow indicates the peak corresponding to the position of the actual Δν. The inset shows the result of applying the CRF to a smaller frequency range that excludes the main peaks from the daily aliases, between 13 and 20 μHz. In the inset, the red dashed curve represents a Gaussian fit to the CRF peak; the centroid and standard deviation of the Gaussian mark the value of Δν and its corresponding uncertainty, as used in this analysis.
Current usage metrics show cumulative count of Article Views (full-text article views including HTML views, PDF and ePub downloads, according to the available data) and Abstracts Views on Vision4Press platform.
Data correspond to usage on the plateform after 2015. The current usage metrics is available 48-96 hours after online publication and is updated daily on week days.
Initial download of the metrics may take a while.