Fig. 2.
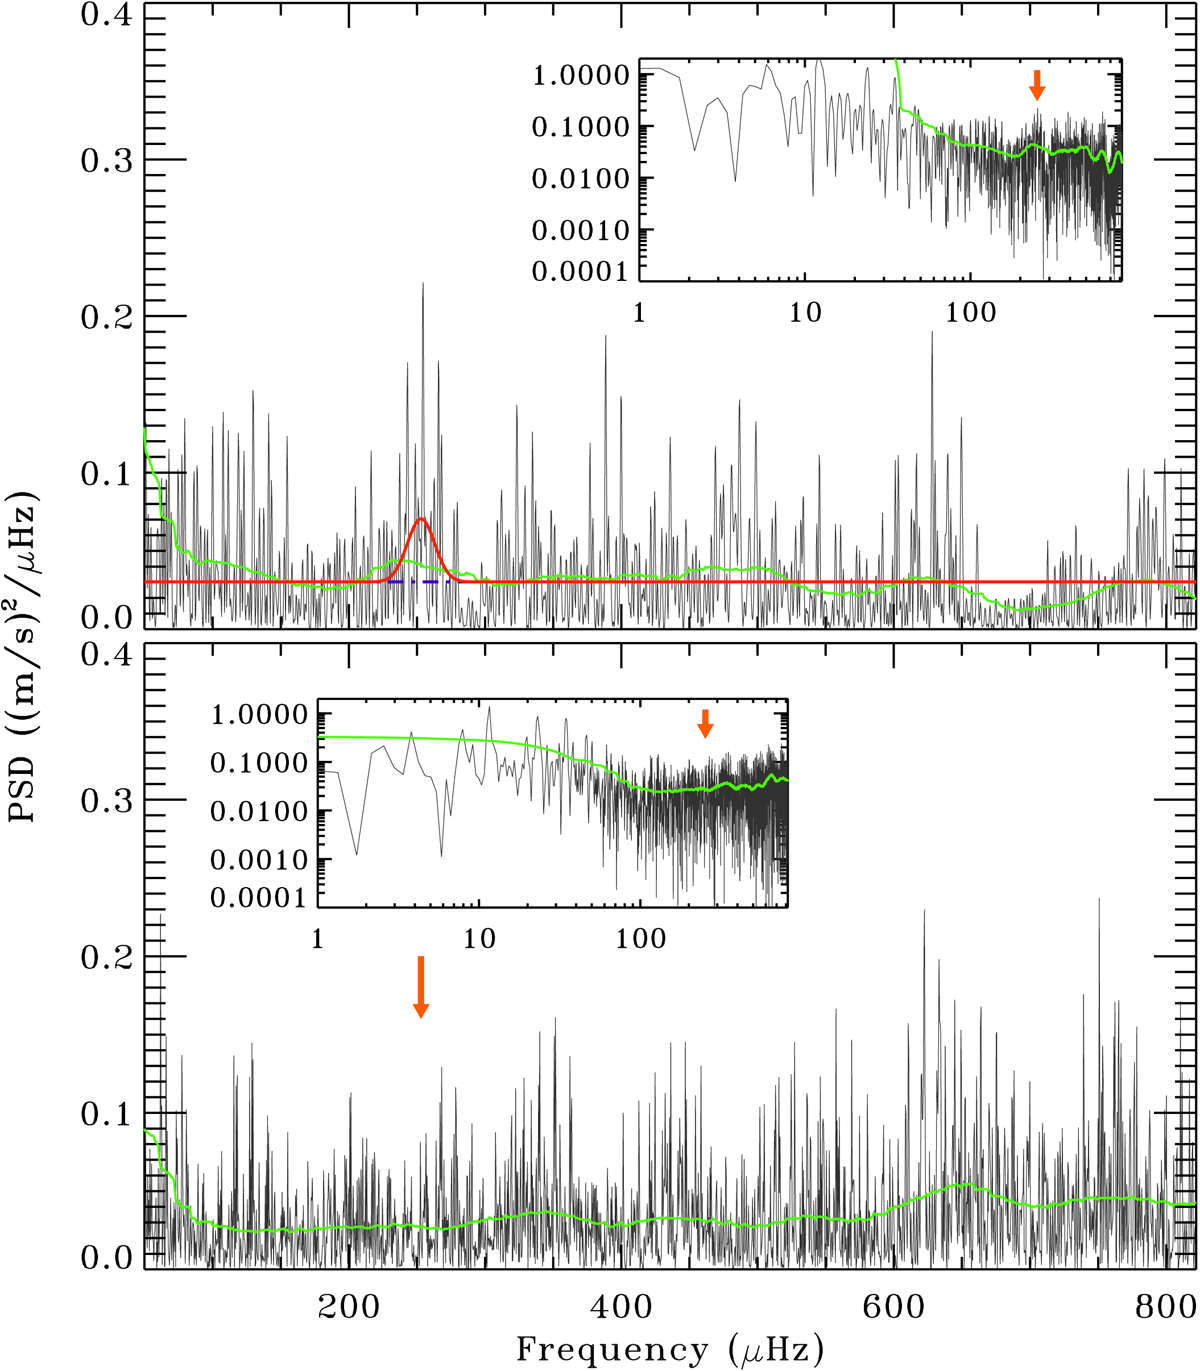
Top panel: power spectral density (in black) and background model fit using DIAMONDS for EK Eri from the eight-night observation run in 2017. The red line shows the total fit including the oscillation power excess, and the dashed blue line below the oscillation hump represents the flat-noise component. The inset shows the same spectrum, but in a log-log scale to help visualize the hump that is caused by oscillations, which is also marked by a red arrow at νmax. A smoothing by 4Δν, with Δν derived from Stello et al. (2009) using νmax from our analysis (solid green line), is also shown. Bottom panel: similar to the top panel, but here using the second observation run in 2018. The position of νmax from the 2017 time-series is indicated by the red arrows, showing that there is no region where significant power excess is found.
Current usage metrics show cumulative count of Article Views (full-text article views including HTML views, PDF and ePub downloads, according to the available data) and Abstracts Views on Vision4Press platform.
Data correspond to usage on the plateform after 2015. The current usage metrics is available 48-96 hours after online publication and is updated daily on week days.
Initial download of the metrics may take a while.