Fig. 3.
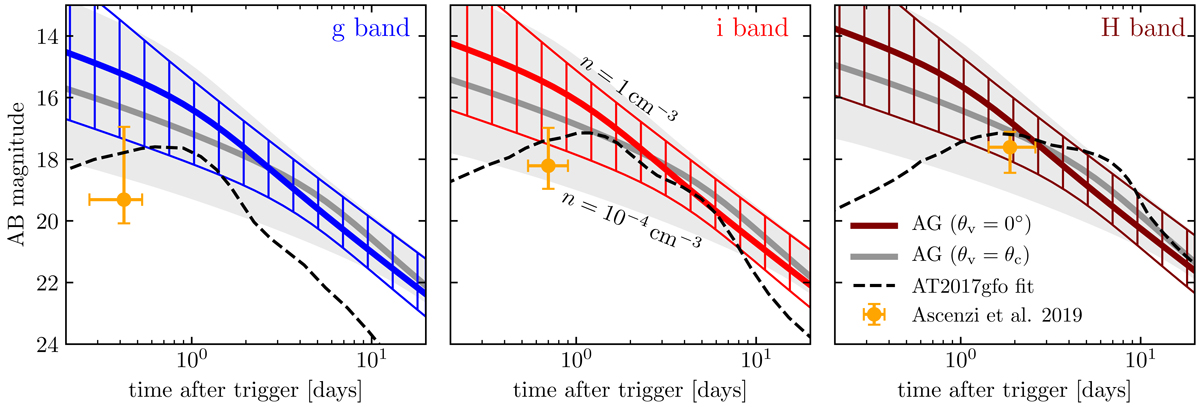
Comparison of the on-axis afterglow of a GRB 170817A-like jet with an AT2017gfo-like kilonova. Each panel shows light curves in a different band, as indicated in the upper right corner. Solid coloured lines represent the on-axis (θv = 0°) jet afterglow (with best-fit parameters and n = 5 × 10⁻³ cm−3), with the hatched region showing the portion of the plane span when assuming ISM densities between n = 10−4 cm−3 and n = 1 cm−3. Grey solid lines and the grey shaded region show the same information for a jet seen at the core border (θv = θc). Black dashed lines show the AT2017gfo kilonova best-fitting model from Villar et al. (2017). The orange points show the median kilonova peak magnitudes and peak times in the three bands, as inferred by Ascenzi et al. (2019) and the error bars enclose 68% of the events according to their distributions.
Current usage metrics show cumulative count of Article Views (full-text article views including HTML views, PDF and ePub downloads, according to the available data) and Abstracts Views on Vision4Press platform.
Data correspond to usage on the plateform after 2015. The current usage metrics is available 48-96 hours after online publication and is updated daily on week days.
Initial download of the metrics may take a while.