Fig. 2.
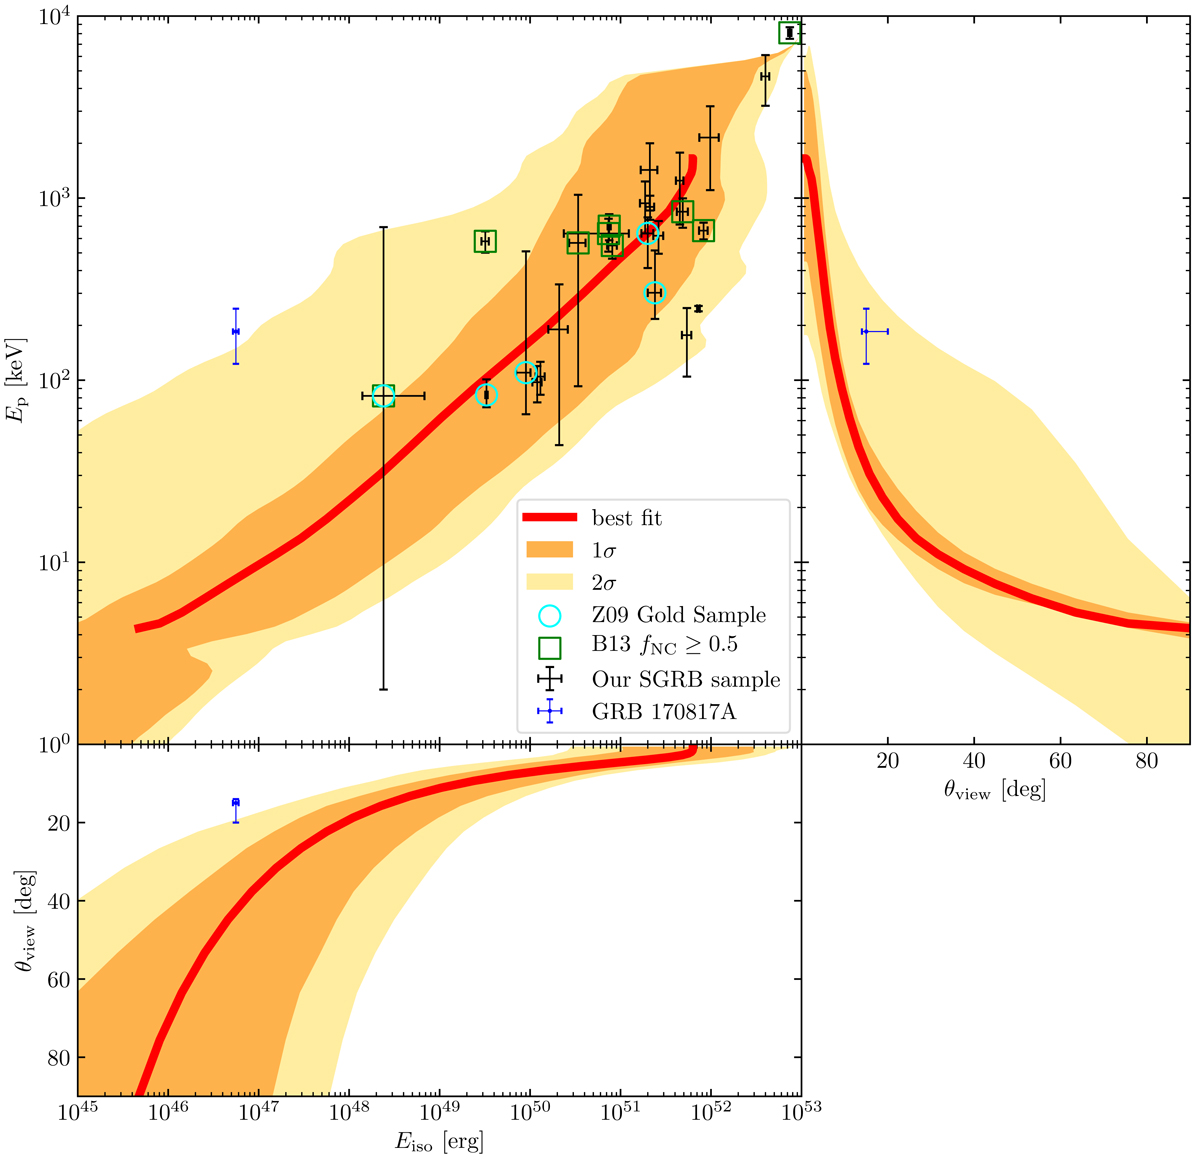
Possible prompt emission of a GRB 170817A-like jet compared to archival SGRB data. The bottom and right-hand panels show respectively the isotropic-equivalent energy Eiso(θv) and the rest-frame SED peak photon energy Ep(θv) as functions of the viewing angle θv (red solid lines) for the best-fit jet structure of Ghirlanda et al. (2019), along with their uncertainty regions (1σ – orange; 2σ – yellow). In the top-left panel, the red solid line shows the corresponding track and uncertainty regions on the (Eiso, Ep) plane. The plots are joined to ease the determination of the viewing angle that corresponds to a given point on the (Eiso, Ep) track. The blue cross shows the observed properties of GRB 170817A, while black crosses show the SGRBs from our sample (Sect. 4.1). Cyan circles mark bursts which belong to the Type I Gold Sample in Z09, while green squares mark bursts that have fNC ≥ 0.5 in the analysis of B13.
Current usage metrics show cumulative count of Article Views (full-text article views including HTML views, PDF and ePub downloads, according to the available data) and Abstracts Views on Vision4Press platform.
Data correspond to usage on the plateform after 2015. The current usage metrics is available 48-96 hours after online publication and is updated daily on week days.
Initial download of the metrics may take a while.