Fig. 1.
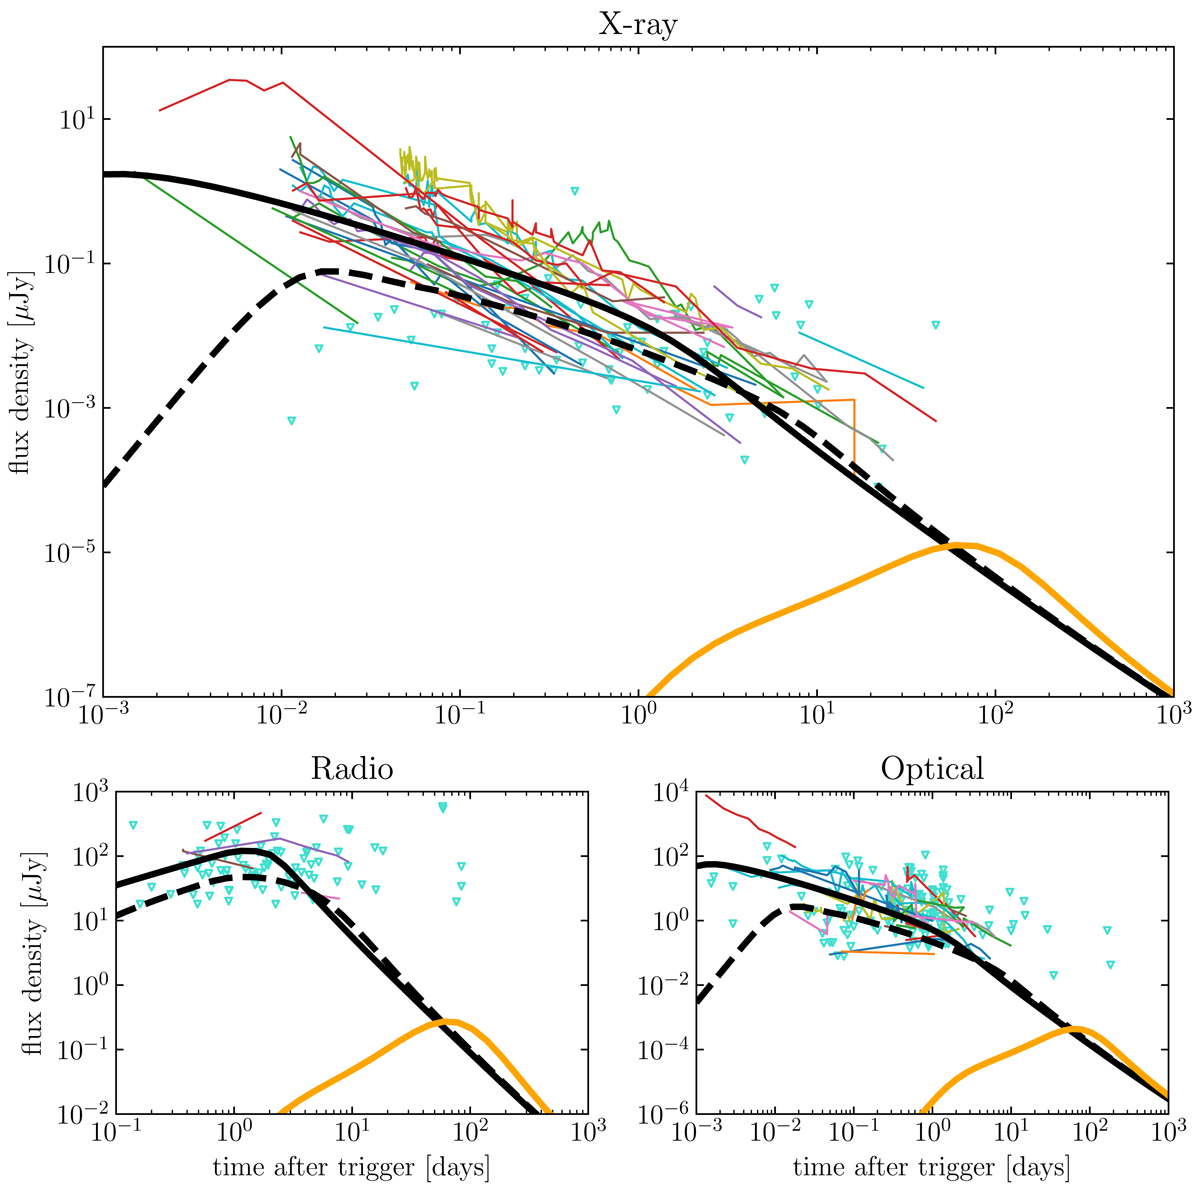
Afterglow of a GRB 170817A-like jet compared to the archival SGRB data from Fong et al. (2015). The redshift and ISM density have been set equal to the medians of the Fong et al. (2015) sample, namely z = 0.46 and n = 5 × 10⁻³ cm−3. Each panel shows data from a different frequency range: radio (1.4 ≤ ν/GHz ≤ 93, bottom left-hand panel), UVOIR (mostly r filter ≈4.8 × 10¹⁴ Hz, bottom right-hand panel), and X-ray (1 keV ≈2.4 × 10¹⁷ Hz, top panel). Upper limits are shown by empty turquoise downward triangles, while detections are shown by thin lines of different colours, each connecting data from a single SGRB. In each panel, thick solid black lines represent the GRB 170817-like jet light curve as seen on-axis, dashed black lines show the light curve for an observer at the border of the core, while solid orange lines show the light curve for viewing angle θv = 15° which corresponds to the best-fit value for GRB 1708017A as given in Ghirlanda et al. (2019). The model light curves are computed for observer frequencies νobs = 6 GHz (radio), 4.8 × 10¹⁴ Hz (optical) and 2.4 × 10¹⁷ Hz (X-ray).
Current usage metrics show cumulative count of Article Views (full-text article views including HTML views, PDF and ePub downloads, according to the available data) and Abstracts Views on Vision4Press platform.
Data correspond to usage on the plateform after 2015. The current usage metrics is available 48-96 hours after online publication and is updated daily on week days.
Initial download of the metrics may take a while.