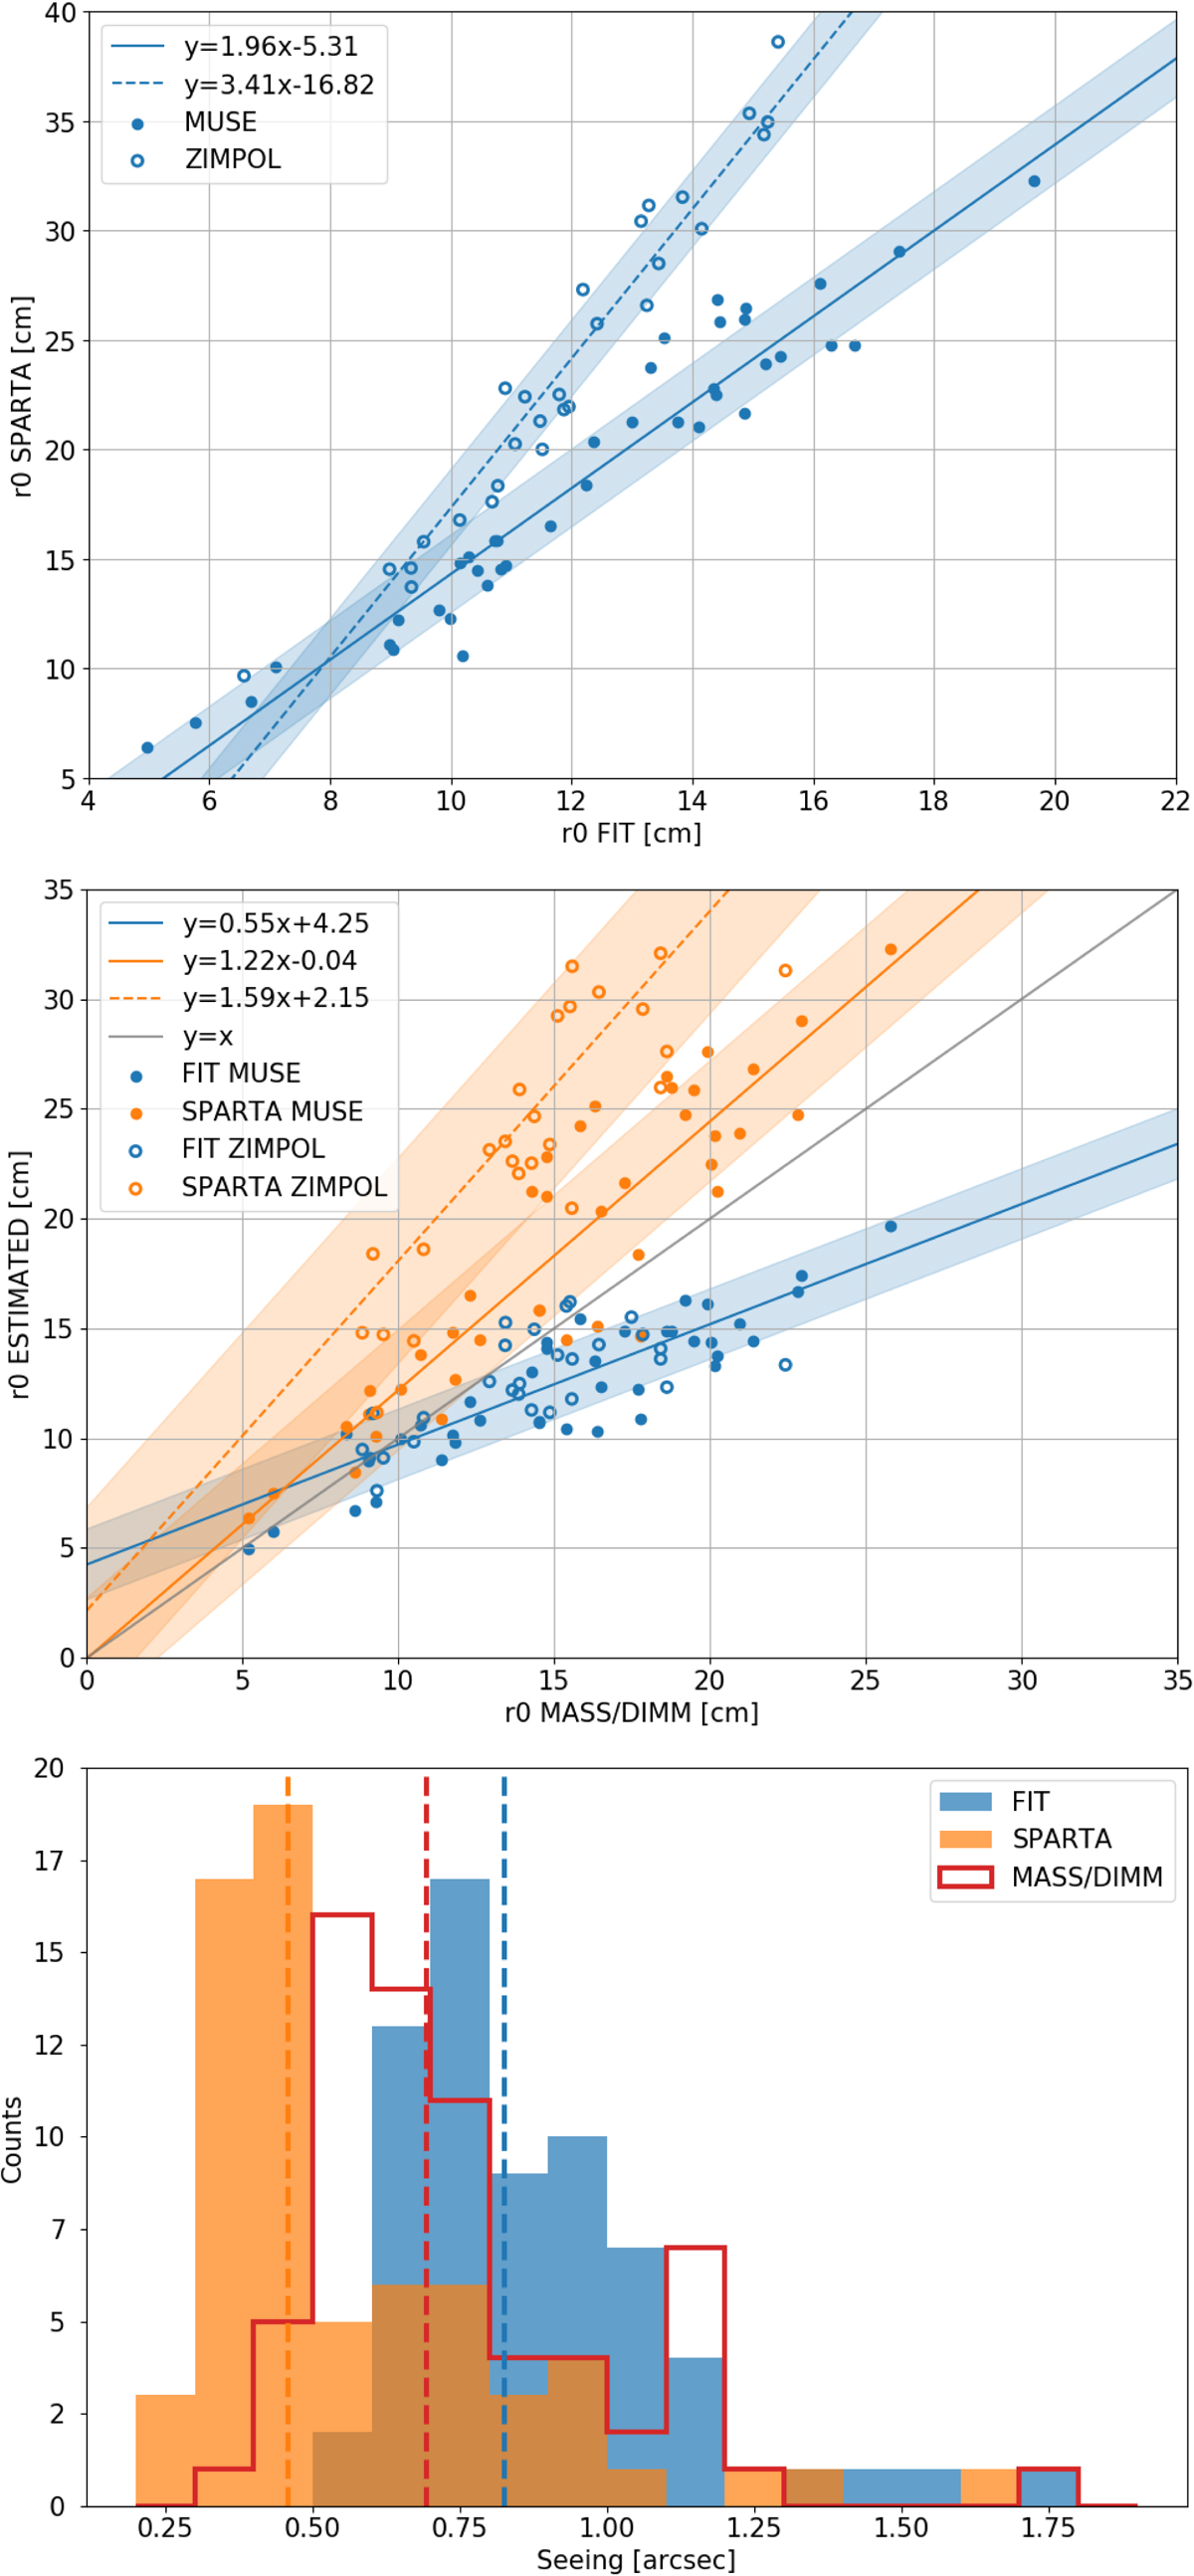
Fig. 8.

Zenital r0 at 500 nm estimated on MUSE (filled circles, 40 data points) and SPHERE/ZIMPOL (empty circles, 27 data points) using three methods: PSF fitting, SPARTA, and MASS/DIMM. Top: r0, SPARTA versus r0, FIT. A different linear tendency is found for MUSE (plain line) and SPHERE/ZIMPOL (dashed line). Shaded areas show the standard deviation between data points and the best linear fit. Middle: r0, SPARTA and r0, FIT versus r0, MASS/DIMM. Two linear tendencies are identified for SPARTA, and only one for PSF fitting. Bottom: histograms of seeing estimated with the three methods on both instruments. Dashed vertical lines show median values of 0.46″ (SPARTA), 0.69″ (MASS/DIMM), and 0.83″ (PSF fitting).
Current usage metrics show cumulative count of Article Views (full-text article views including HTML views, PDF and ePub downloads, according to the available data) and Abstracts Views on Vision4Press platform.
Data correspond to usage on the plateform after 2015. The current usage metrics is available 48-96 hours after online publication and is updated daily on week days.
Initial download of the metrics may take a while.


