Fig. 7.
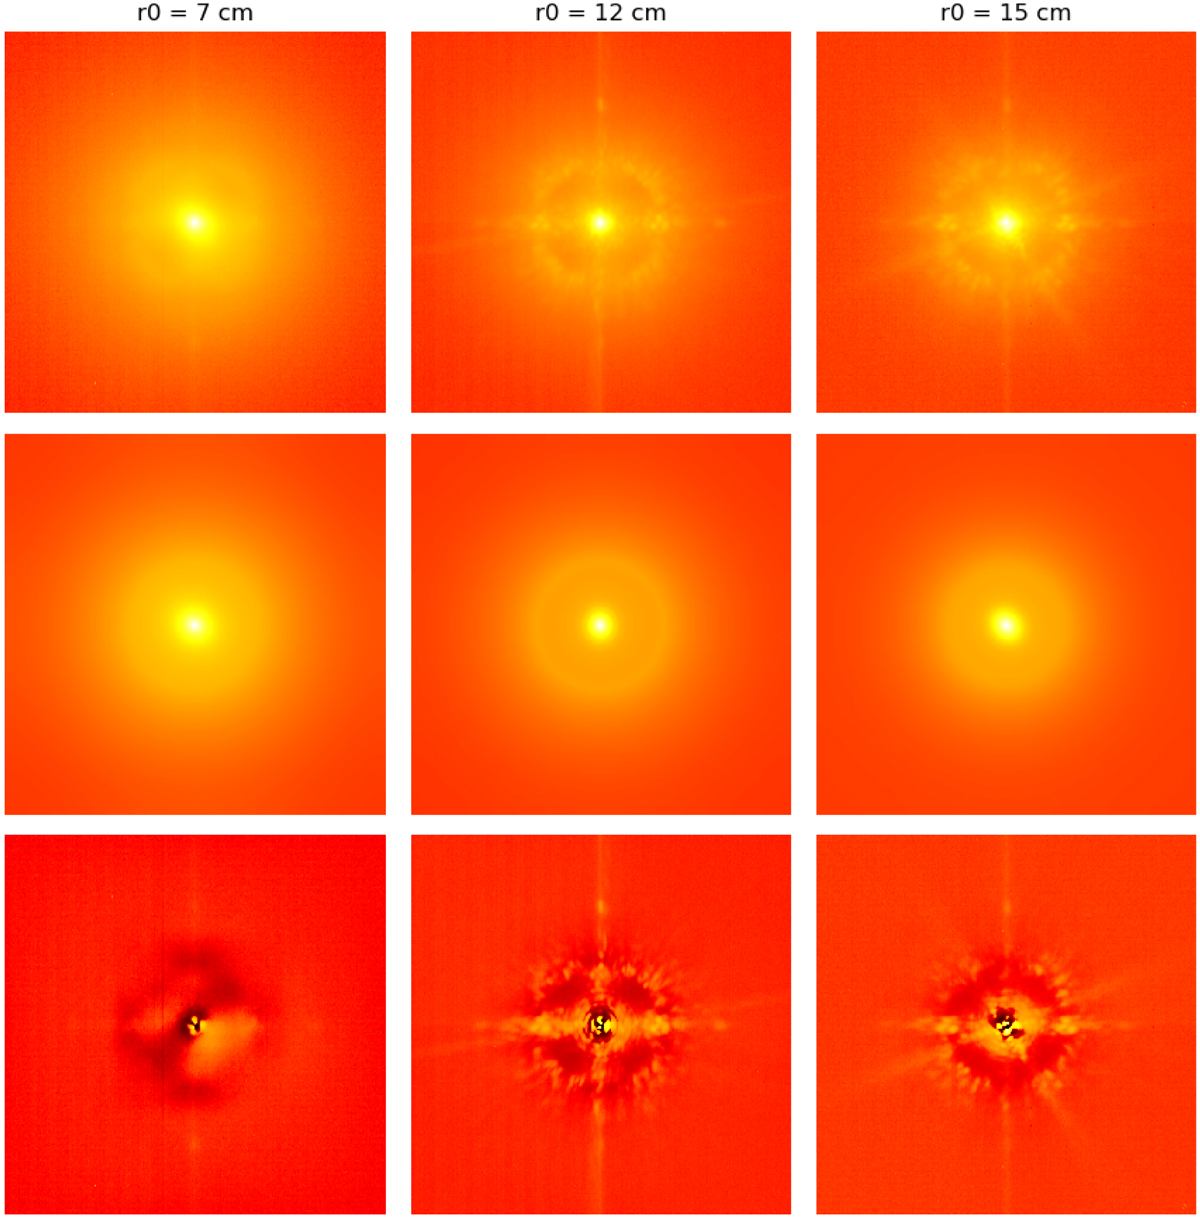
Three ZIMPOL PSFs (top), model fittings (middle), residuals (bottom). Left: minimal r0 of the sample. Middle: median r0. Right: maximal r0. The main differences are due to some static aberrations not taken into account in our model (only the pupil and its central obstruction are taken into account). The hyperbolic arcsine of the intensity is shown to enhance details. The same intensity scale is used per column (data, model, residuals), but differs between columns.
Current usage metrics show cumulative count of Article Views (full-text article views including HTML views, PDF and ePub downloads, according to the available data) and Abstracts Views on Vision4Press platform.
Data correspond to usage on the plateform after 2015. The current usage metrics is available 48-96 hours after online publication and is updated daily on week days.
Initial download of the metrics may take a while.