Open Access
Fig. 6.
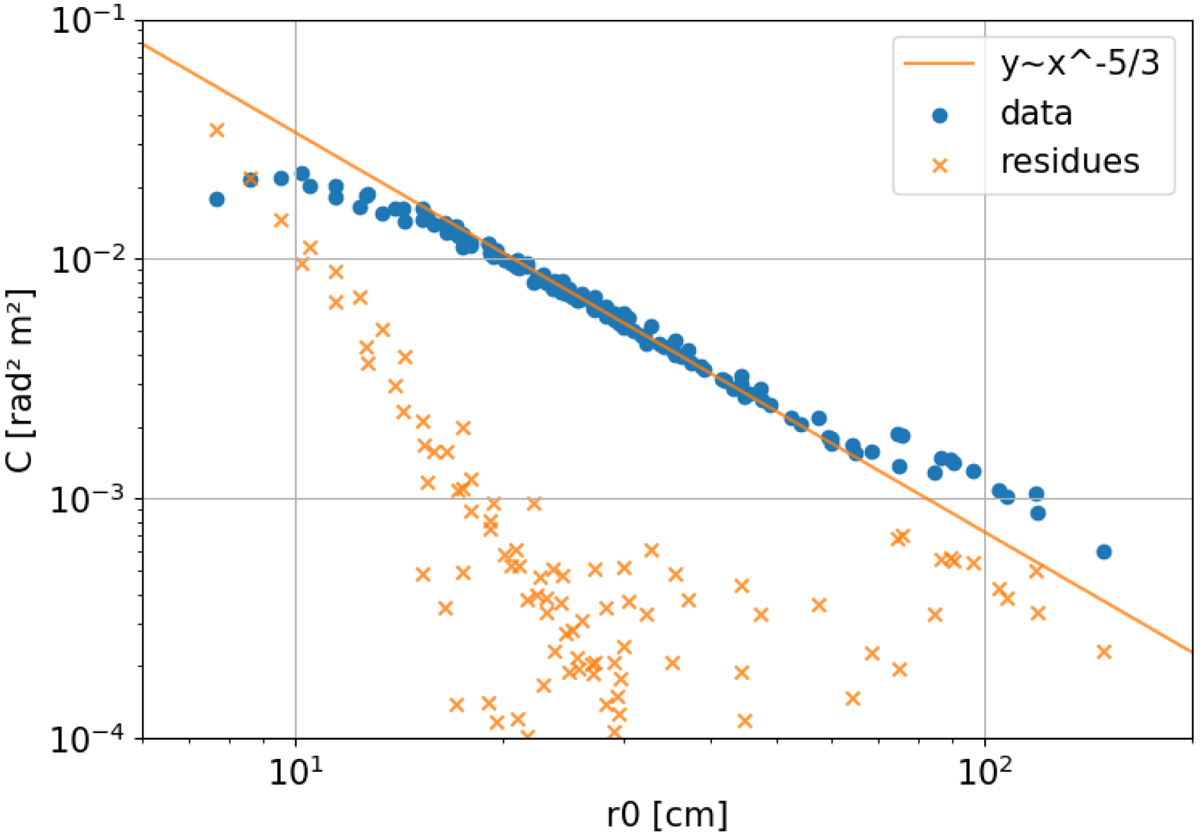
Estimation of the PSF constant C versus the r0 given at the observed wavelength (dots). A ![]() fitting equation (solid line) is applied on the data. Residuals between each data point and the
fitting equation (solid line) is applied on the data. Residuals between each data point and the ![]() power law are also shown (crosses).
power law are also shown (crosses).
Current usage metrics show cumulative count of Article Views (full-text article views including HTML views, PDF and ePub downloads, according to the available data) and Abstracts Views on Vision4Press platform.
Data correspond to usage on the plateform after 2015. The current usage metrics is available 48-96 hours after online publication and is updated daily on week days.
Initial download of the metrics may take a while.