Fig. 4.
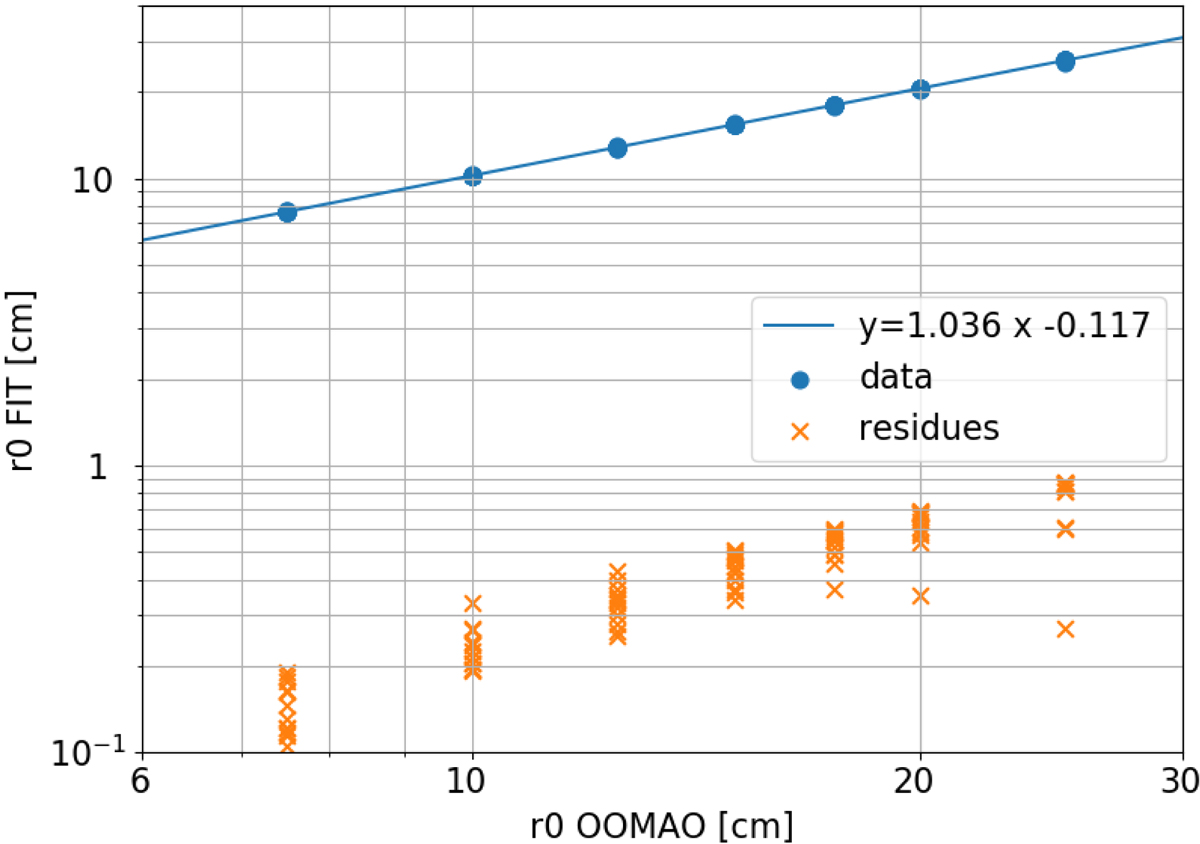
Fried parameter r0 estimated by fitting versus the r0 used in OOMAO to generate the PSF. All r0 are given at 500 nm. Here are shown results on 84 different PSFs, corresponding to seven values of r0 and 12 different wavelengths. The line is the linear fit between our r0 estimation and OOMAO r0. Crosses show residuals |r0, FIT − r0, OOMAO|. A log–log scale is used to show on the same graph both data and residuals.
Current usage metrics show cumulative count of Article Views (full-text article views including HTML views, PDF and ePub downloads, according to the available data) and Abstracts Views on Vision4Press platform.
Data correspond to usage on the plateform after 2015. The current usage metrics is available 48-96 hours after online publication and is updated daily on week days.
Initial download of the metrics may take a while.