Fig. 3.
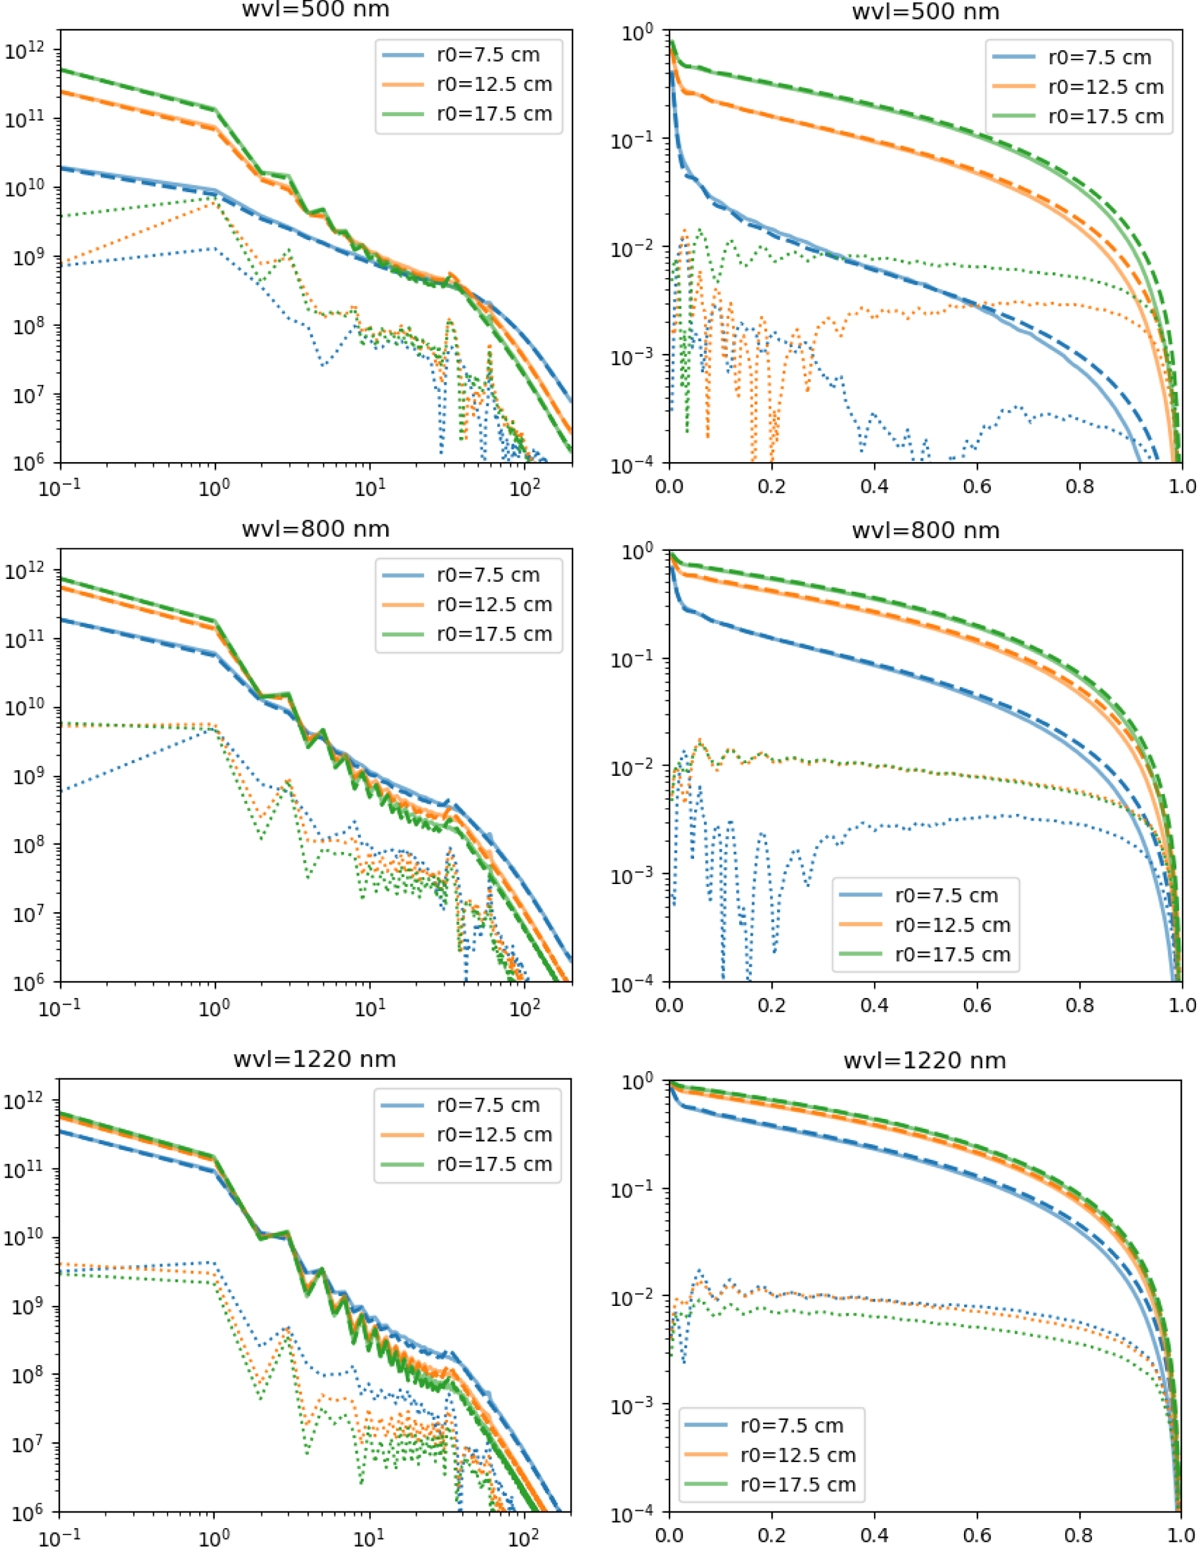
OOMAO PSF fitting with our model. Left: circular average for PSFs (given in photons). The vertical grey line corresponds to the AO cutoff radius. Right: corresponding circular average for OTFs (normalized to unity at the null frequency). From top to bottom, three wavelengths are scanned from 500 nm to 1220 nm. Colours correspond to three values of the OOMAO required r0. Solid curves: OOMAO. Dashed: fitting. Dotted: residuals. All PSFs, for all wavelengths, are sampled at Shannon–Nyquist.
Current usage metrics show cumulative count of Article Views (full-text article views including HTML views, PDF and ePub downloads, according to the available data) and Abstracts Views on Vision4Press platform.
Data correspond to usage on the plateform after 2015. The current usage metrics is available 48-96 hours after online publication and is updated daily on week days.
Initial download of the metrics may take a while.