Fig. 2.
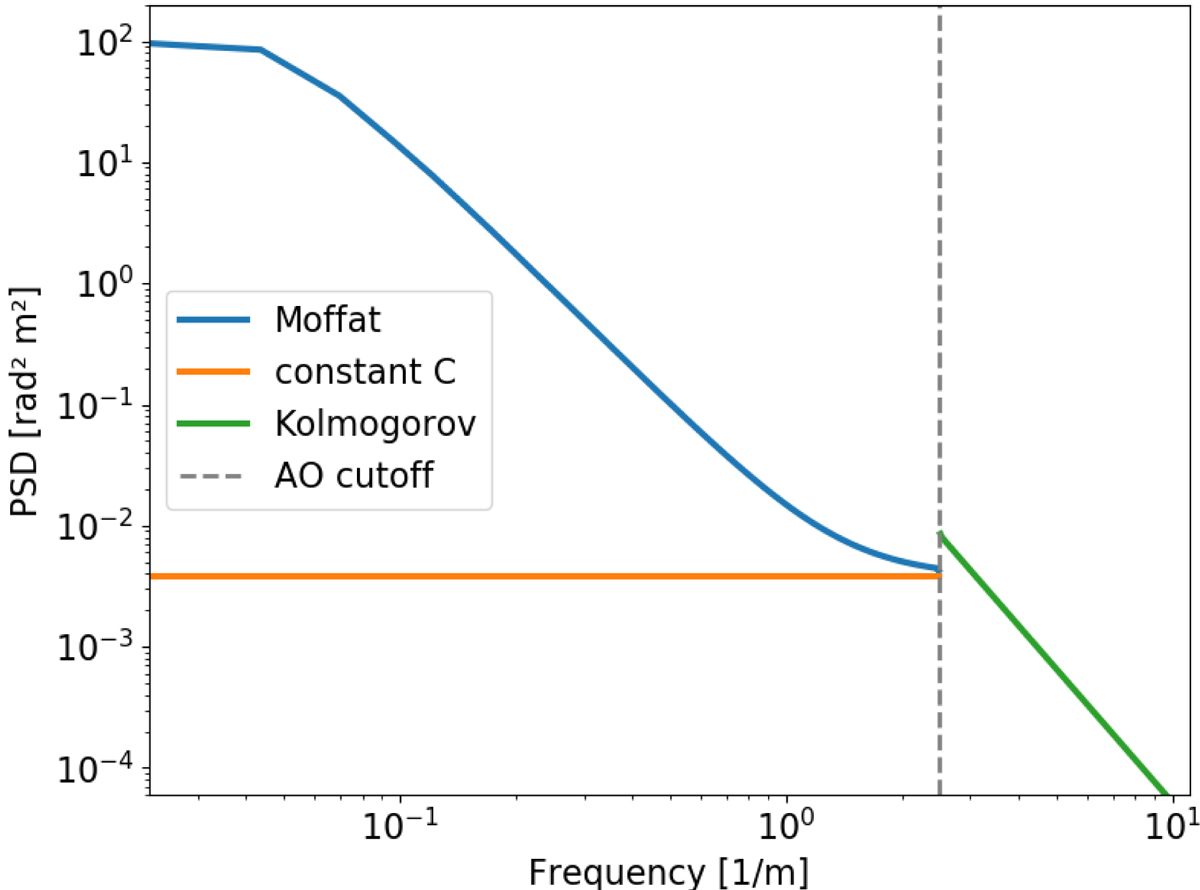
Three components of the PSD model: the Moffat (blue) and the constant contribution (orange) below the AO cutoff frequency, and the Kolmogorov spectrum (green) above the AO cutoff frequency. Discontinuity has been exaggerated by reducing C to show this degree of freedom in our model. Plotting is in logarithmic–logarithmic scale.
Current usage metrics show cumulative count of Article Views (full-text article views including HTML views, PDF and ePub downloads, according to the available data) and Abstracts Views on Vision4Press platform.
Data correspond to usage on the plateform after 2015. The current usage metrics is available 48-96 hours after online publication and is updated daily on week days.
Initial download of the metrics may take a while.