Fig. 7.
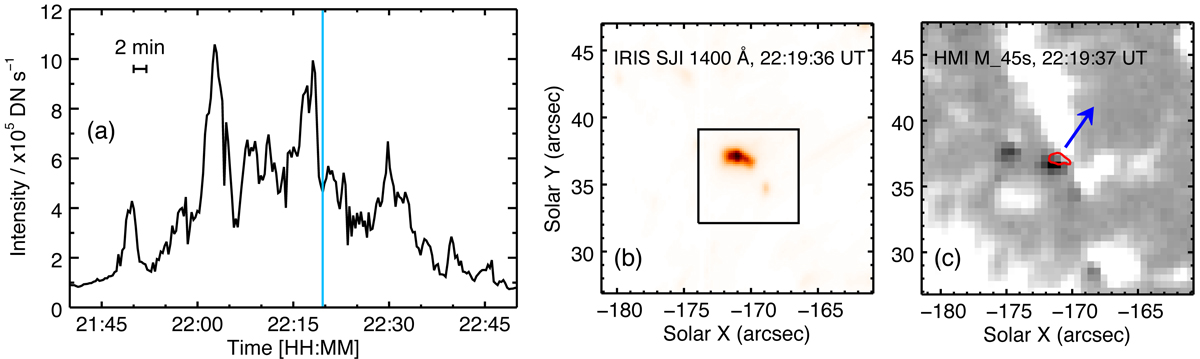
Temporal evolution of a solar UV burst observed by IRIS on 2013 October 22. The temporal variation of the intensity in the IRIS 1400 Å channel essentially showing the light curve in the Si IV line is plotted in panel a. Panel b: immediate surroundings of the UV burst as seen in the 1400 Å channel (reverse linear intensity scaling) at the time indicated by the vertical blue line in panel a. The box in panel b surrounding the UV burst outlines the region where we integrated the emission to derive the light curve in panel a. The line-of-sight component of the magnetic field based on HMI is shown in panel c with a linear scaling of the magnetic field in the range ±200 G. The location of the UV burst is over-plotted with a red contour of the 1400 Å channel intensity. This only appears between a small negative (dark) magnetic polarity and a major opposite (white) polarity. The blue arrow indicates the direction of motion of the minor negative-polarity feature that causes the UV burst. See Sect. 4.2 for details.
Current usage metrics show cumulative count of Article Views (full-text article views including HTML views, PDF and ePub downloads, according to the available data) and Abstracts Views on Vision4Press platform.
Data correspond to usage on the plateform after 2015. The current usage metrics is available 48-96 hours after online publication and is updated daily on week days.
Initial download of the metrics may take a while.