Fig. 5.
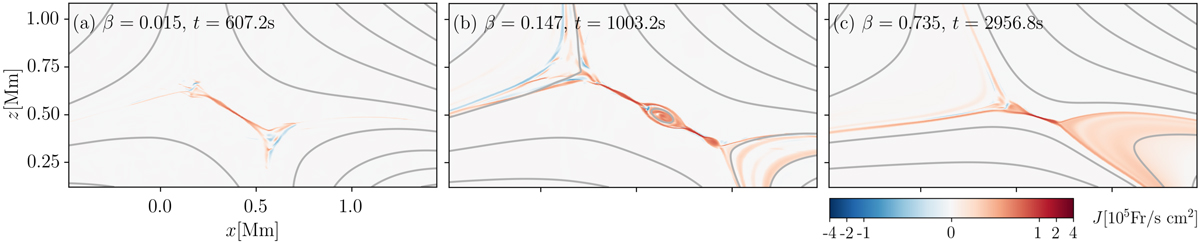
Plasmoid-mediated reconnection under different plasma-β conditions. The panels show snapshots of the current density, J, for three different models with different values of plasma-β according to values given in the plots. The snapshots for low and moderate β in panels a and b are taken around the time when the overall evolution of Jmax reaches a maximum. The snapshot for high β in panel c represents the situation when the Jmax reached stably high values (cf. Fig. 4a). See Sect. 3.3.
Current usage metrics show cumulative count of Article Views (full-text article views including HTML views, PDF and ePub downloads, according to the available data) and Abstracts Views on Vision4Press platform.
Data correspond to usage on the plateform after 2015. The current usage metrics is available 48-96 hours after online publication and is updated daily on week days.
Initial download of the metrics may take a while.