Fig. 4.
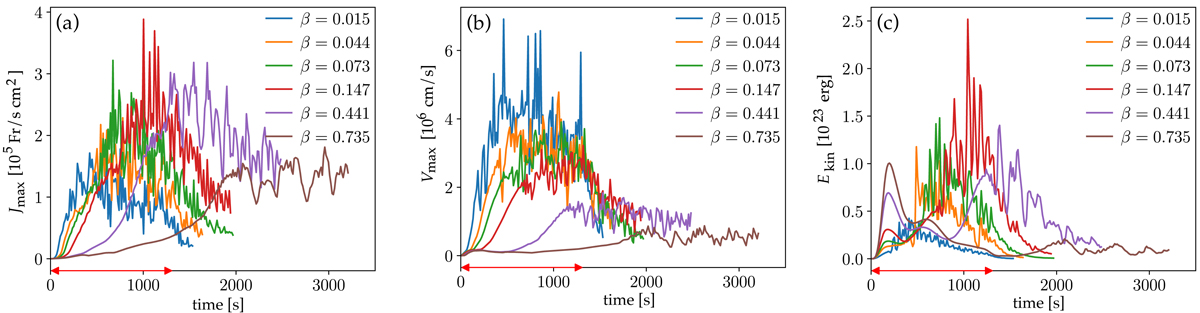
Evolution of reconnection for different plasma-β. Here we show the temporal variation of the maximum current, Jmax (panel a), and the maximum velocity, Vmax (panel b), in the vicinity of the reconnection region as defined by the dashed rectangles in Figs. 2b–d. Panel c: total kinetic energy, Ekin, integrated over the same rectangle. The differently colored curves show the evolution for the models with different plasma-β in the reconnection region as outline in the legend. The red double-arrows indicate the time of the driving at the bottom boundary. See Sect. 3.2.
Current usage metrics show cumulative count of Article Views (full-text article views including HTML views, PDF and ePub downloads, according to the available data) and Abstracts Views on Vision4Press platform.
Data correspond to usage on the plateform after 2015. The current usage metrics is available 48-96 hours after online publication and is updated daily on week days.
Initial download of the metrics may take a while.