Fig. 3.
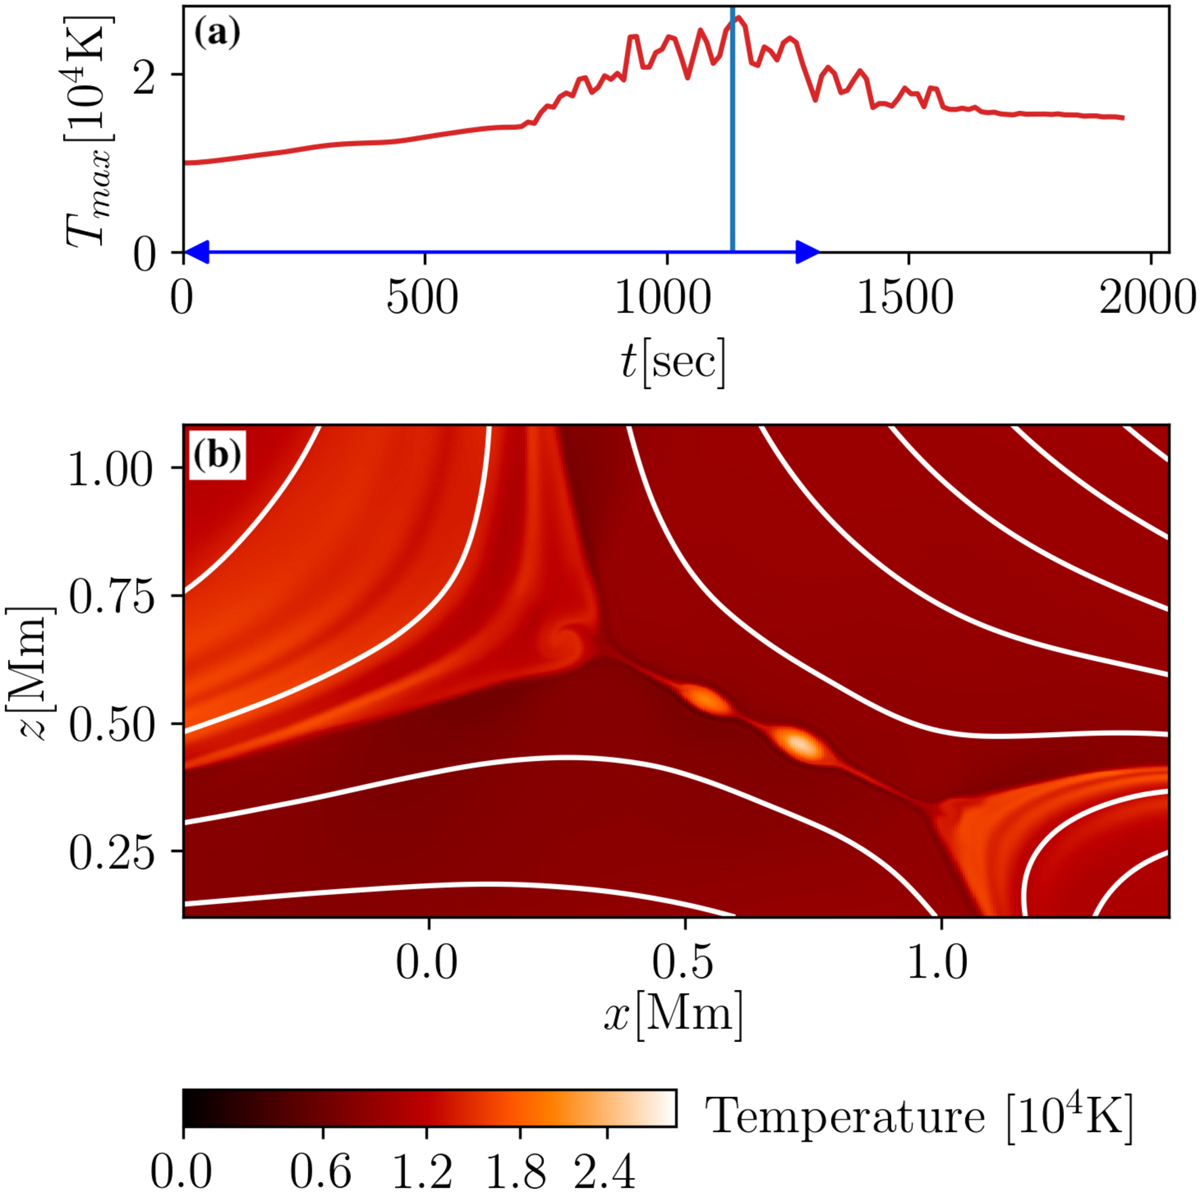
Zoom into reconnection region showing plasmoids and temperature for β = 0.147. This is similar to Fig. 2, but we now show the temporal evolution of the maximum temperature around the reconnection region in panel a and a snapshot of the temperature in panel b that is taken at the time indicated by the blue vertical line in panel a. At this snapshot there are two (resolved) plasmoids present in the reconnection region clearly seen as near-circular regions of enhanced temperature in the middle of panel b. The field of view corresponds to the rectangle indicated in Figs. 2b–d. The blue double-arrow indicates the time of the driving at the bottom boundary; see Sect. 3.1.
Current usage metrics show cumulative count of Article Views (full-text article views including HTML views, PDF and ePub downloads, according to the available data) and Abstracts Views on Vision4Press platform.
Data correspond to usage on the plateform after 2015. The current usage metrics is available 48-96 hours after online publication and is updated daily on week days.
Initial download of the metrics may take a while.