Fig. 2.
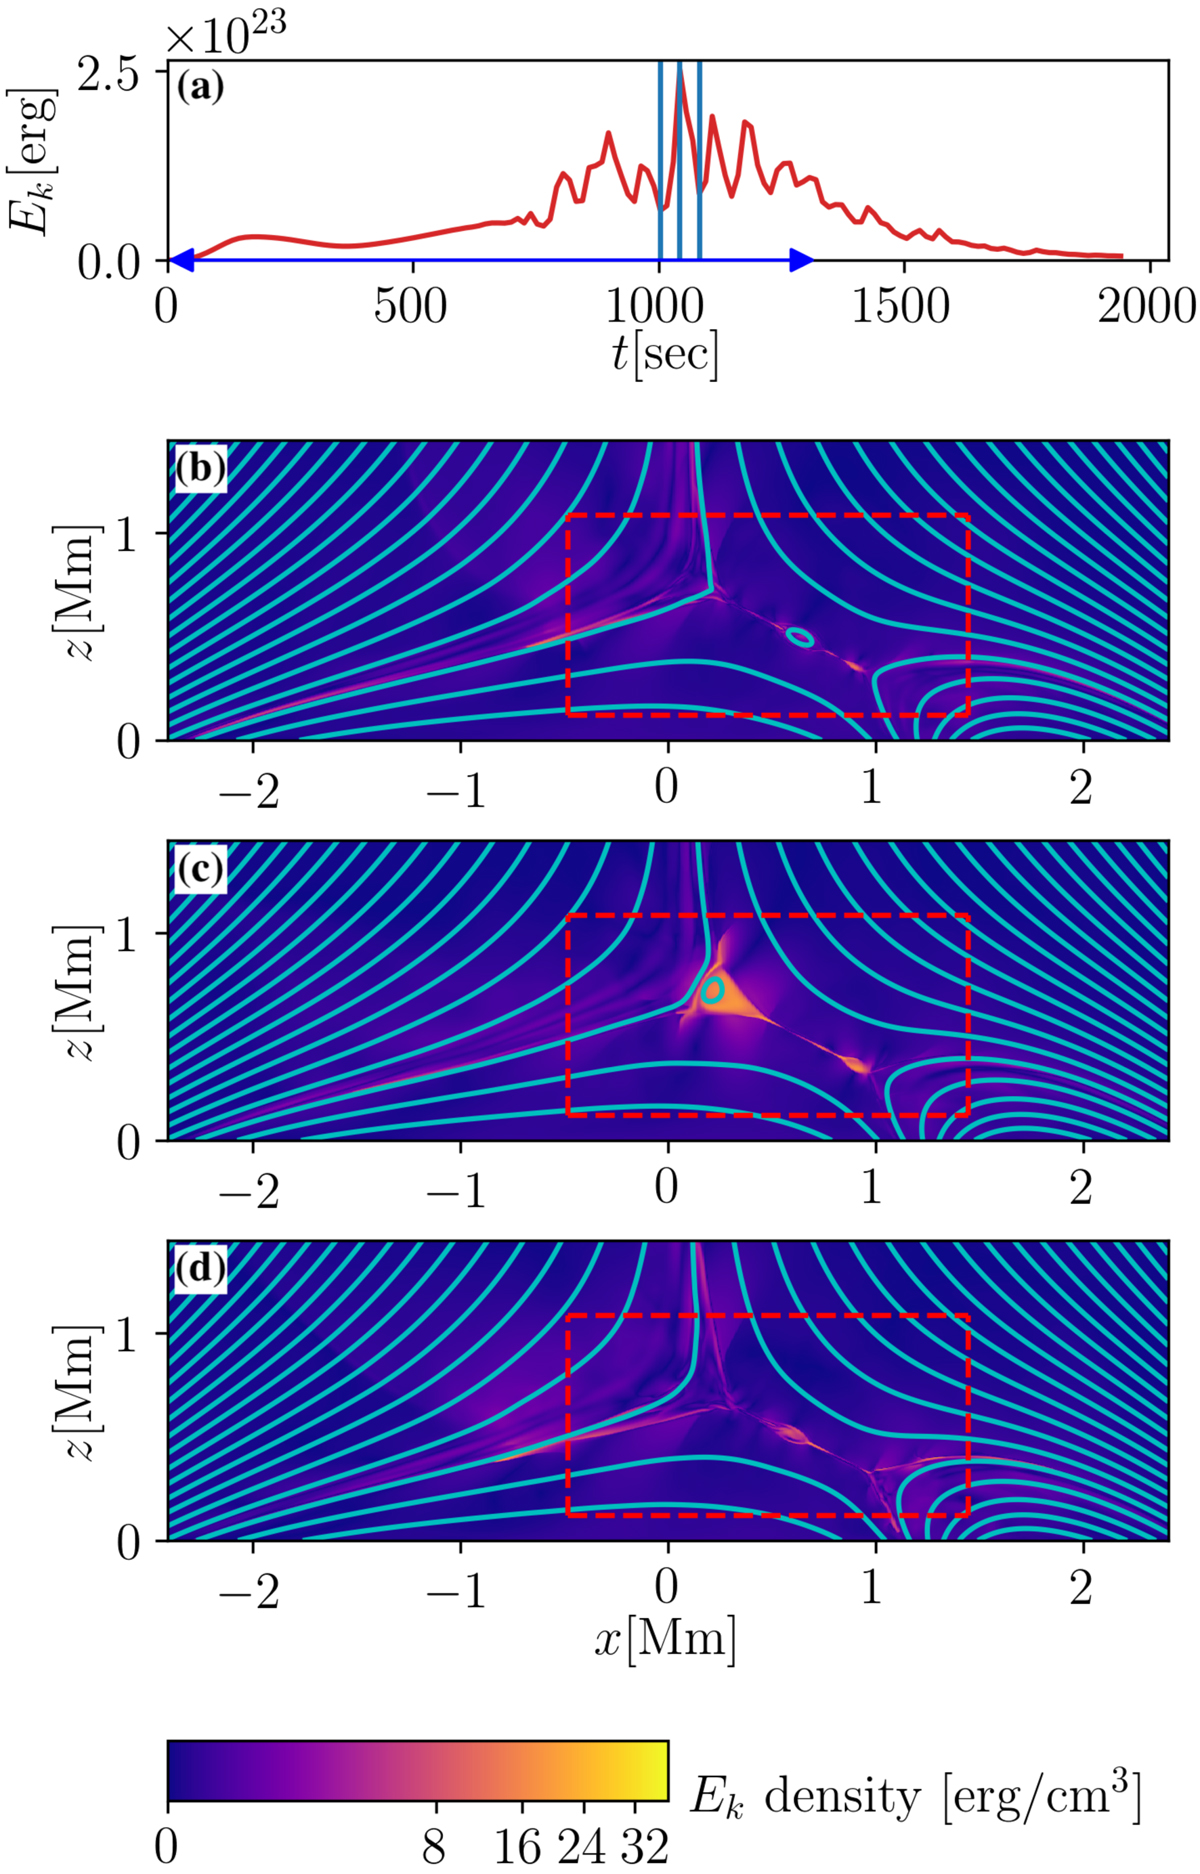
Overall evolution of magnetic field and kinetic energy during reconnection for β = 0.147. Panel a: the temporal evolution of the kinetic energy integrated in a rectangle around the reconnection region (dashed lines in lower panels). Panels b–d: snapshots of the kinetic energy density along with magnetic field lines in part of the computational domain (cf. dashed rectangle in Fig. 1a). These are taken sequentially at the times indicated in the top panel by the vertical blue lines. The current sheet forms roughly along the diagonal of the rectangle. The compact near-circular enhancements of the kinetic energy indicate the location of the plasmoids that form. The blue double-arrow in panel a indicates the time of the driving at the bottom boundary. The plasmoids and the overall evolution are best seen in the animation available online; see Sect. 3.1.
Current usage metrics show cumulative count of Article Views (full-text article views including HTML views, PDF and ePub downloads, according to the available data) and Abstracts Views on Vision4Press platform.
Data correspond to usage on the plateform after 2015. The current usage metrics is available 48-96 hours after online publication and is updated daily on week days.
Initial download of the metrics may take a while.